There are plenty of reasons for Wednesday's sell off: plunging oil, weakness in junk bonds, bank exposure to the energy sector, Greek drama and the usual Euro stuff. One thing was clear: there were more sellers than buyers on Wednesday. I do not know the reasons behind every seller's decision to sell, but I do know that Wednesday was a distribution day. The decline pushed SPY and QQQ back to support. IWM remained just above support and still shows a little relative strength this month. This puts the short-term uptrends at their moment-of-truth. Either the market firms and bounces soon, or we get breakdowns that reverse the short-term uptrends.
**This chart analysis is for educational purposes only, and should not
be construed as a recommendation to buy, sell or sell-short said securities**
Short-term Overview (Thursday, 11-December-2014):
- The evidence is mixed, but breadth and trend still favor the bulls.
- The AD Lines are in uptrends and I marked the key levels to watch for a break down.
- The three bond-related risk indicators are negative, but the two stock specific indicators are positive.
- SPY is testing key support in the 203-204 area and short-term oversold.
- QQQ is testing key support in the 103 area and short-term oversold.
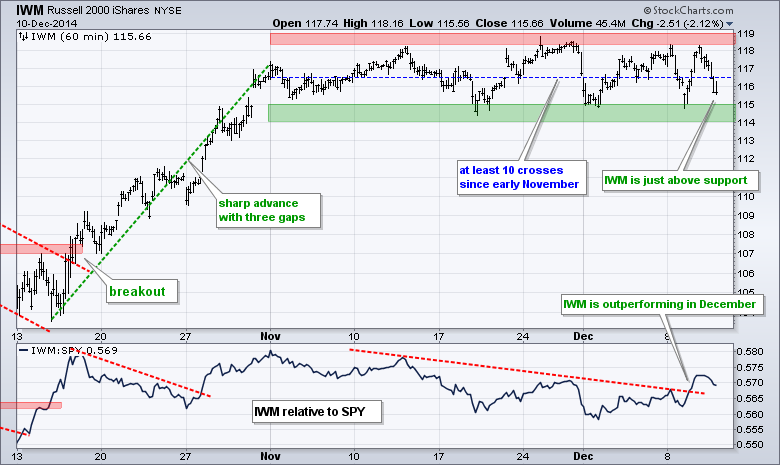
- IWM is holding up a little better because it is still above range support.
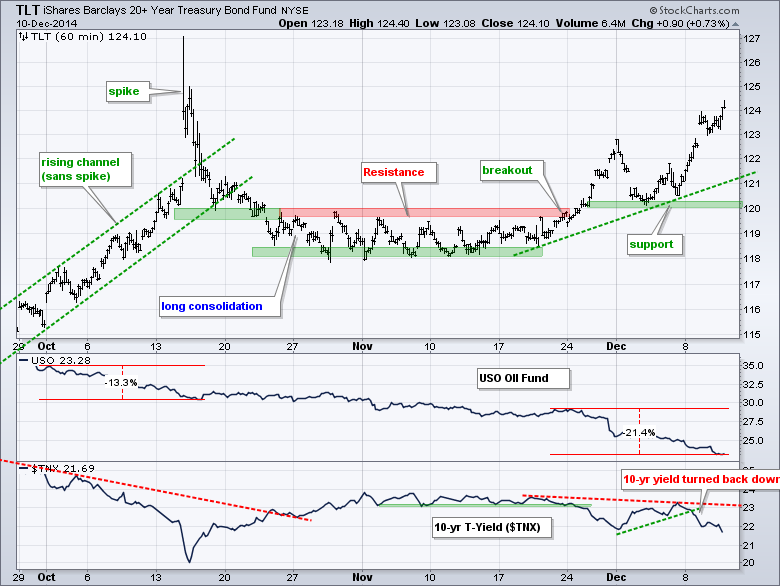
- TLT remains in an uptrend with key support at 120.
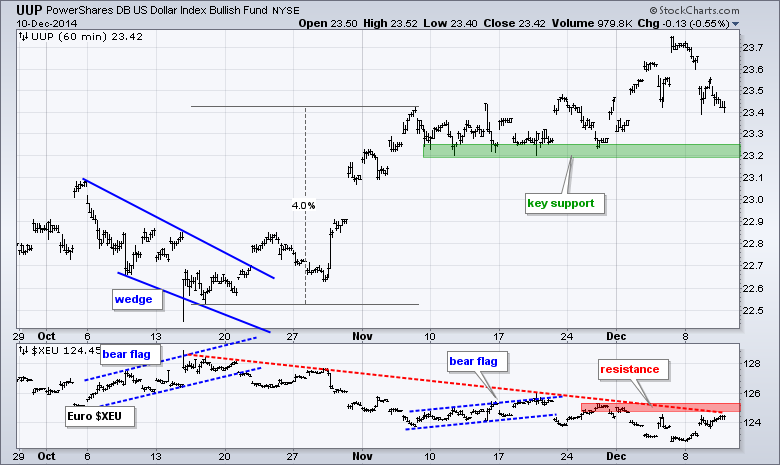
- UUP fell back this week and the Euro bounced, but the Euro is nearing resistance.
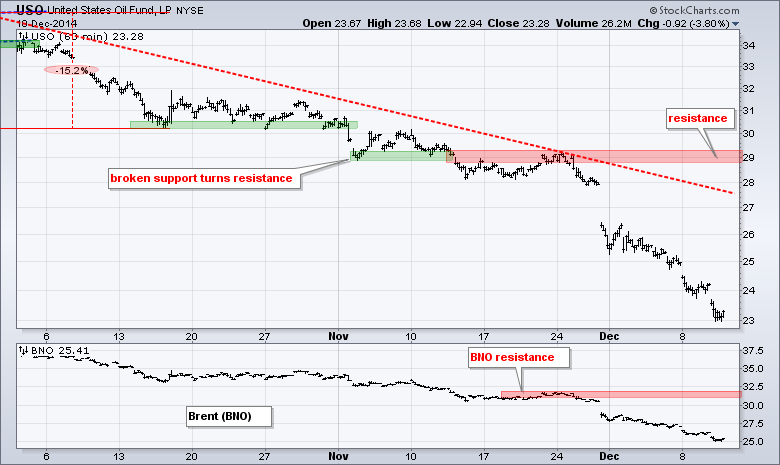
- USO firmed early last week, but fell again to continue its strong downtrend.
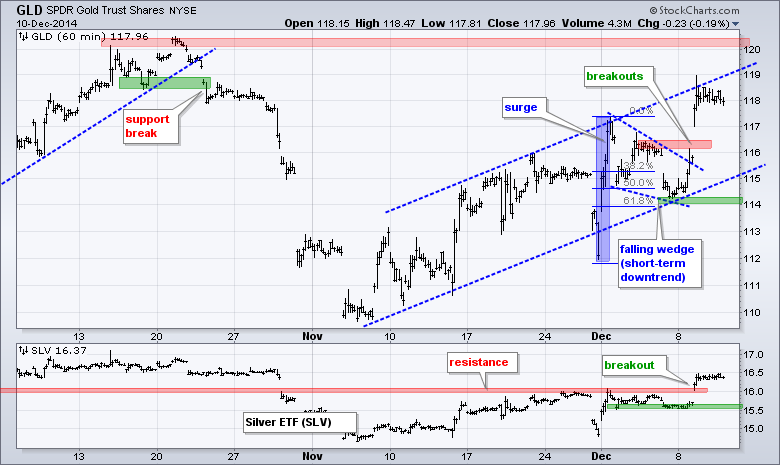
- GLD is in a short-term uptrend, but I think this is a bear market rally.
The December E-mini S&P 500 (^ESZ14) started the day under selling pressure, continued lower and finished near the low of the session. A long black candlestick formed as the E-mini closed at the bottom of its support zone to set up a big test of bullish resolve.
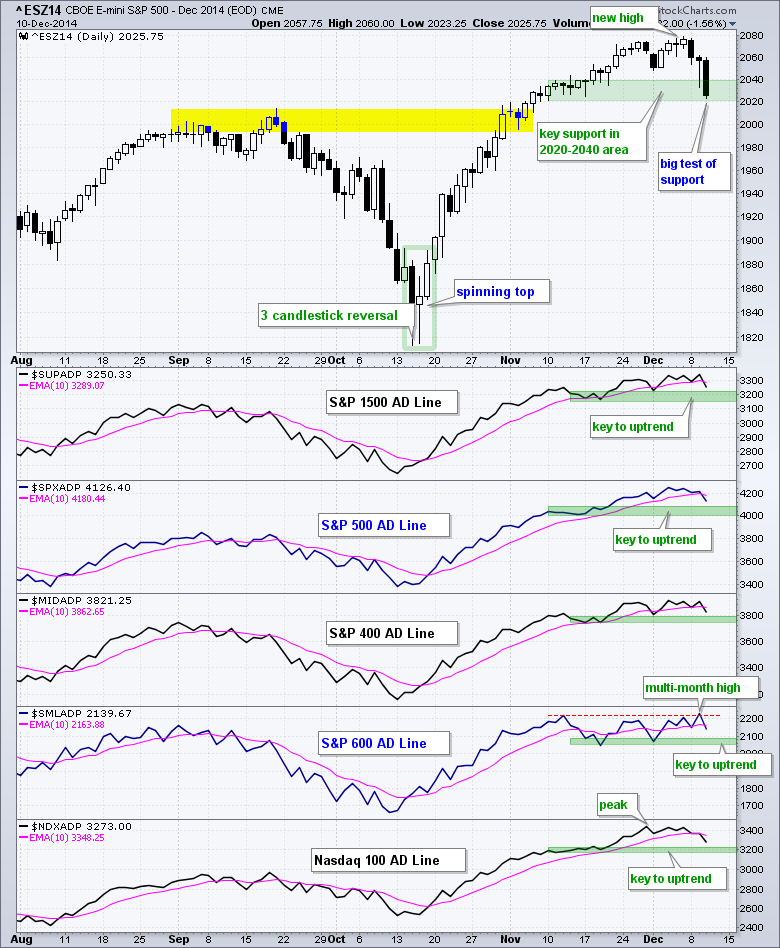
All five AD Lines moved below their 10-day EMAs, but they are still in uptrends. The green zones on each line mark the key area to watch for a break down. These areas correspond to the mid November lows and breaks would signal the start of a downtrend in these breadth indicators.
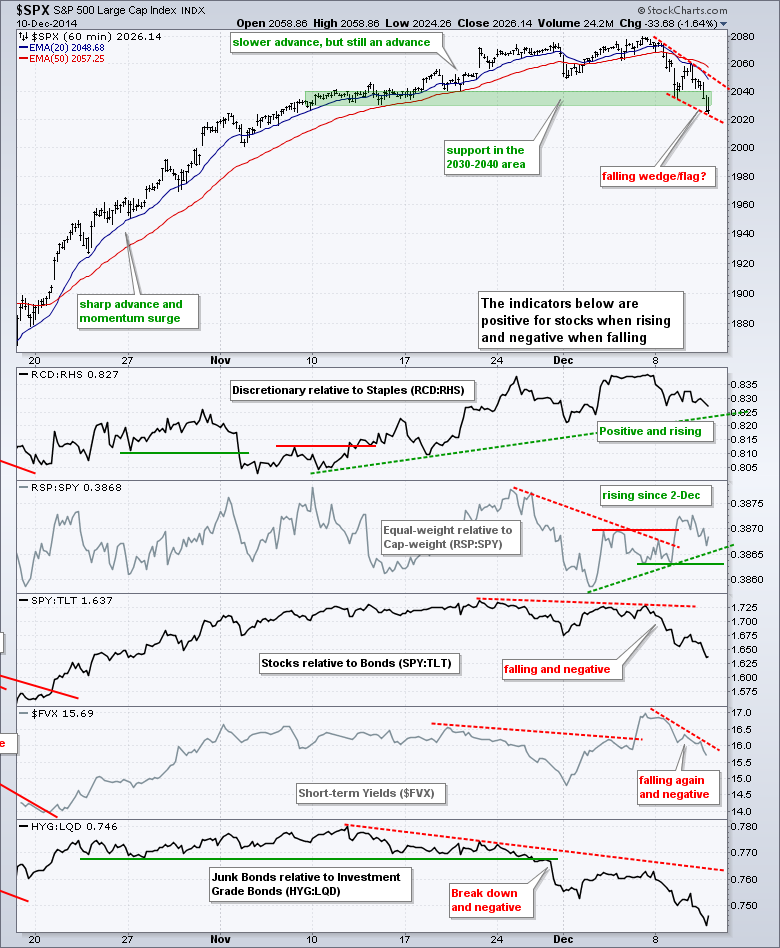
Three of the five risk indicators are negative. The two stock-specific risk indicators are still positive. The consumer discretionary sector has been outperforming the consumer staples sector since 10-November and the equal-weight S&P 500 has been outperforming the S&P 500 since 2-Dec. Break downs in both of these would be quite negative for stocks. The three bond-related indicators are negative. SPY is underperforming TLT, JNK, the 5-year Treasury Yield ($FVX) is falling again and JNK is underperforming LQD.
There are clearly some issues in the credit markets right now. Junk bonds have been hit with weakness in energy-related issues and weakness throughout the energy sector is affecting financial institutions with high exposure to energy. This is pushing money into relative safety (Treasury bonds). The decline in oil is also pushing down inflation expectations and this is positive for Treasury bonds.
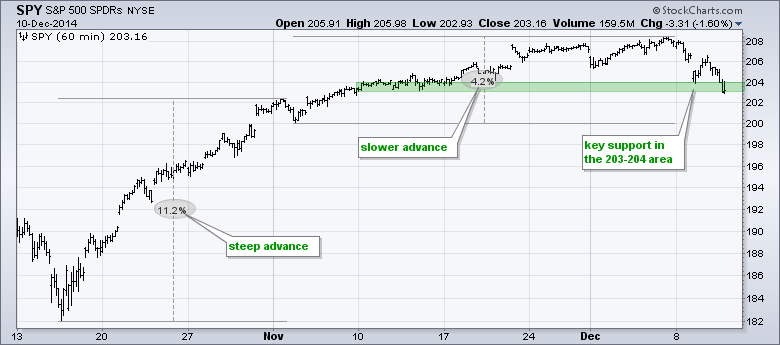
SPY fell to the lower end of its support zone on Wednesday and this is the first big test of the short-term uptrend. The ETF is short-term oversold, at short-term support and in a long-term uptrend. Note that 2-period RSI moved below 10 on the daily chart. This is the first spot to expect a bounce. Failure to hold here would reverse the short-term uptrend.
**************************************************************
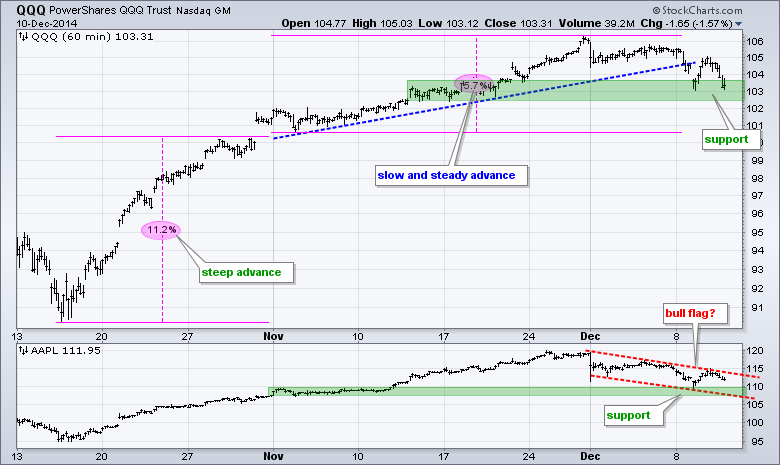
QQQ dipped back into the support zone around 103 for the second time this week. The big trend is up, the ETF is short-term oversold and at support. This sets the stage for a bounce and an important test. A move below 102.5 would clearly break support and reverse the short-term uptrend. The indicator window shows AAPL holding above Tuesday's low and hugging the upper trend line of a falling flag.
**************************************************************
It is easy come and easy go for IWM as the ETF gave up Tuesday's gains with a plunge back below 116. IWM has now crossed the 116.5 area at least ten times in the last six weeks. While SPY is testing support, IWM is just above support and still showing some relative strength in December. Notice how the price relative rose this month and broke above the November trend line.
**************************************************************
Oil is down over 20% in the last few weeks and the 20+ YR T-Bond ETF (TLT) is up over 3%. Weakness in oil is helping Treasury bonds in two ways. First, money is moving out of energy related junk bonds and finding its way into safer assets. Second, the fall in oil is disinflationary and this is positive for Treasury bonds. Key support remains at 120.
**************************************************************
The US Dollar ETF (UUP) fell back this week and the Euro Index ($XEU) bounced, but the overall trends remain the same. The Euro is nearing resistance in the 124.5-125 area and the bounce could reverse soon. UUP remains above its support zone in the 23.20 area and in a clear uptrend.
**************************************************************
No change. The USO Oil Fund (USO) tried to firm, but selling pressure hit again and the ETF hit another new low on Friday. The oversold simply remain oversold and this is testament to the strength of the downtrend. Key resistance remains in the 29 area for now.
**************************************************************
No change. The long-term trend remains down for the Gold SPDR (GLD), but the ETF got a wedge breakout over the last two days and surged to the upper trend line of a rising channel. I would not call this resistance, but it does represent a sort of short-term overbought area. The wedge low marks key support at 114. The indicator window shows the Silver ETF (SLV) also getting a breakout with the surge above 16.
***************************************************************
Key Reports and Events (all times Eastern):
Thu - Dec 11 - 08:30 - Initial Jobless Claims
Thu - Dec 11 - 08:30 - Retail Sales
Thu - Dec 11 - 10:30 - Natural Gas Inventories
Fri - Dec 12 - 08:30 - Producer Price Index (PPI)
Fri - Dec 12 - 09:55 - Michigan Sentiment
Charts of Interest are on Tuesdays and Thursdays.
This commentary and charts-of-interest are designed to stimulate thinking. This analysis is not a recommendation to buy, sell, hold or sell short any security (stock ETF or otherwise). We all need to think for ourselves when it comes to trading our own accounts. First, it is the only way to really learn. Second, we are the only ones responsible for our decisions. Think of these charts as food for further analysis. Before making a trade, it is important to have a plan. Plan the trade and trade the plan. Among other things, this includes setting a trigger level, a target area and a stop-loss level. It is also important to plan for three possible price movements: advance, decline or sideways. Have a plan for all three scenarios BEFORE making the trade. Consider possible holding times. And finally, look at overall market conditions and sector/industry performance.


