The major index ETFs were mixed on Tuesday, but the leadership role flipped in favor of small-caps. DIA, SPY and QQQ moved lower, while IWM and IJR edged higher. Moreover, small-caps opened weak with the rest of the market and came roaring back once participants figured out that most small-caps have zero exposure to Greece. The finance, healthcare and materials sectors led small-caps. Oh, and small-cap energy stocks got a big oversold bounce. Overall, IWM has been consolidating since early November and SPY has been consolidating since late November. The bigger trends are up and these consolidations are considered rests within this uptrend.
**This chart analysis is for educational purposes only, and should not
be construed as a recommendation to buy, sell or sell-short said securities**
Short-term Overview (Wednesday, 10-December-2014):
- Breadth is bullish, the trends are up and three risk indicators are positive.
- The S&P Small-Cap 600 AD Line hit a multi-month high.
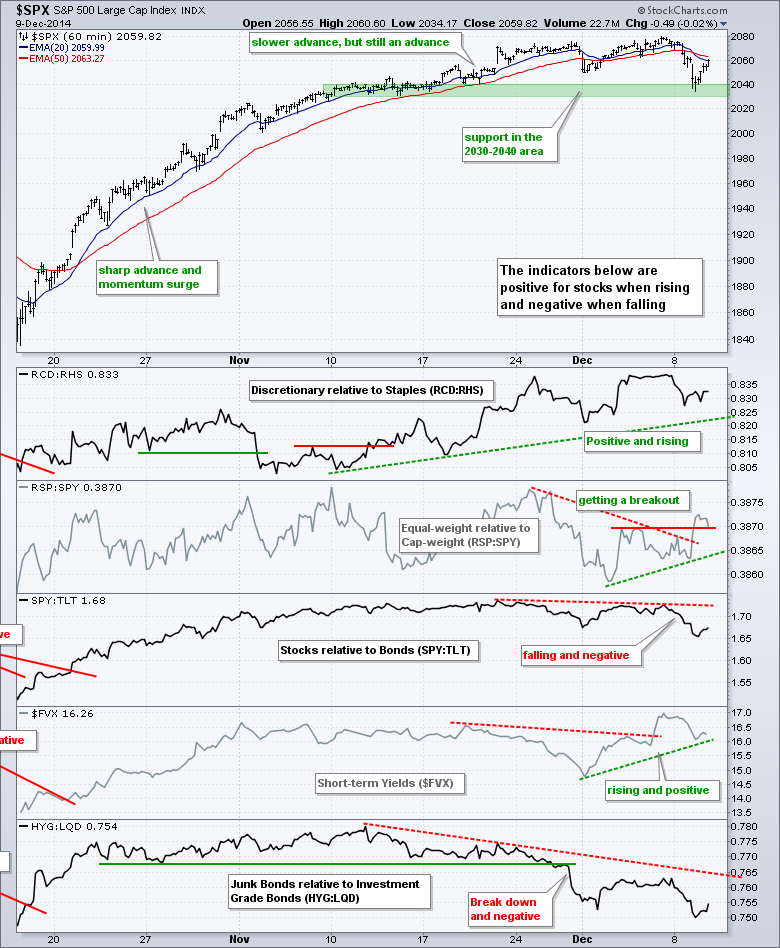
- The S&P 500 equal-weight ETF is starting to outperform the S&P 500 ETF.
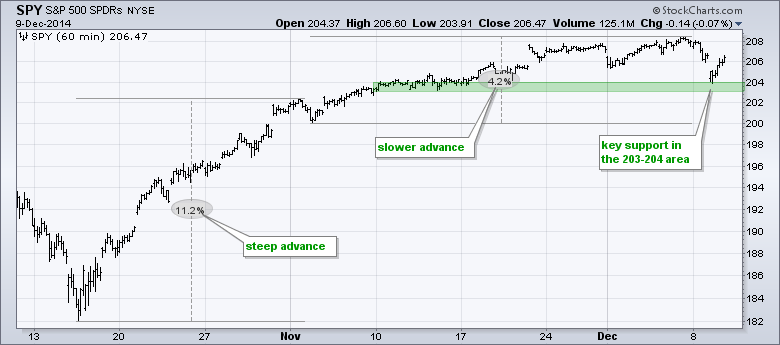
- SPY bounced off the 203-204 area to confirm this key support zone.
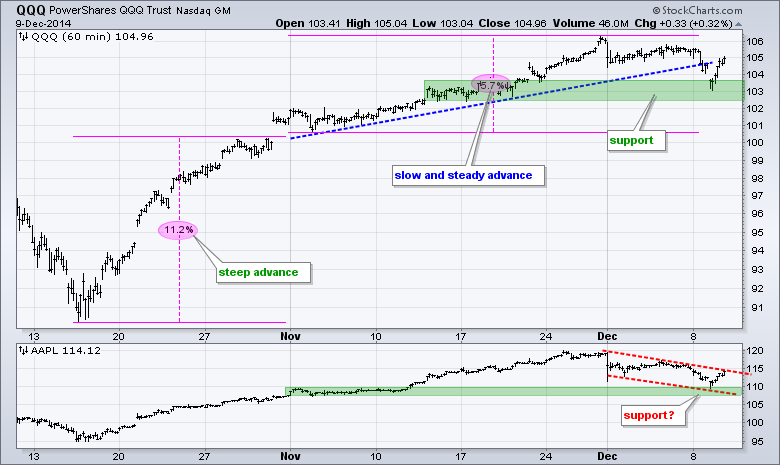
- QQQ bounced off the 102.5-103.5 area to confirm this key support zone.
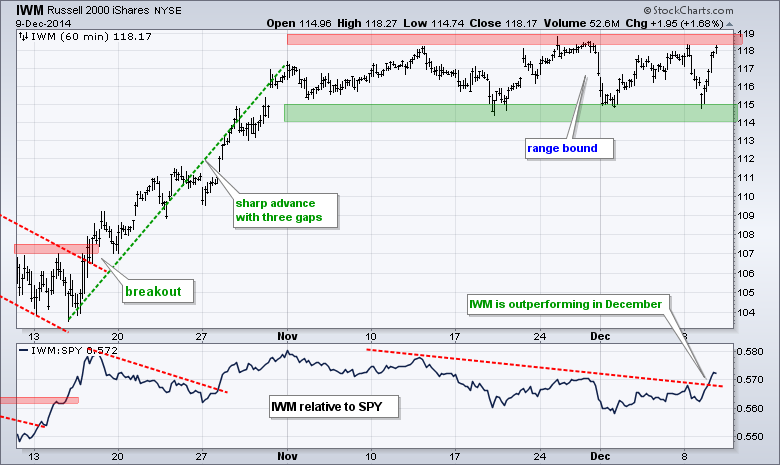
- IWM bounced off range support and is once again challenging range resistance.
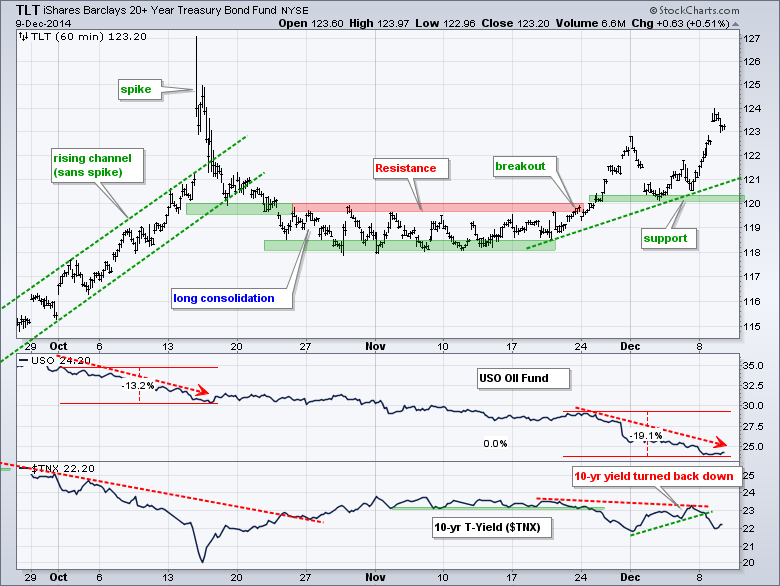
- TLT extended its bounce off support and remains in an uptrend. Key support remains at 120.
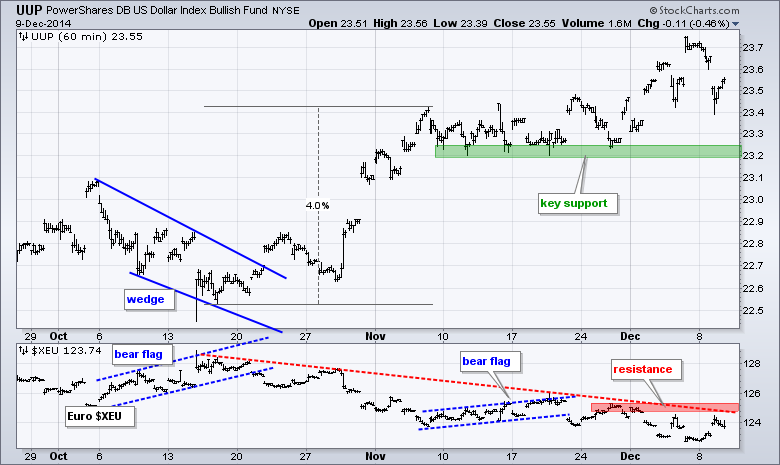
- UUP fell back over the last two days, but the overall trend is clearly up with key support at 23.20.
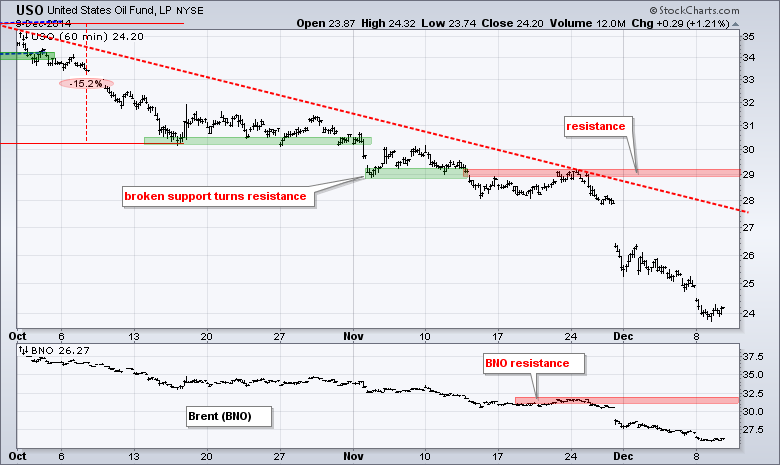
- USO firmed early last week, but fell again to continue its strong downtrend.
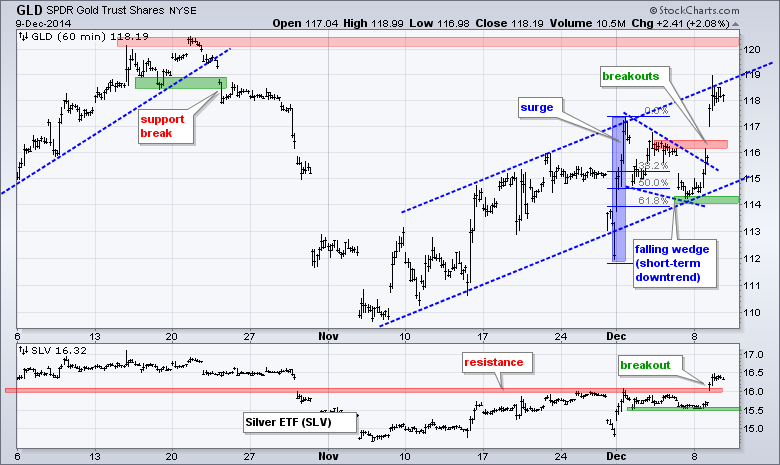
- GLD surged above the wedge trend line and broke resistance over the last two days. Support is set at 114.
The December E-mini S&P 500 (^ESZ14) dipped below 2040 in early trading and then rallied back above 2050 by the close to forge an intraday reversal and affirm support in the 2020-2040 area. The trend here is still up and it looks as if the E-mini is simply consolidating after a big advance.
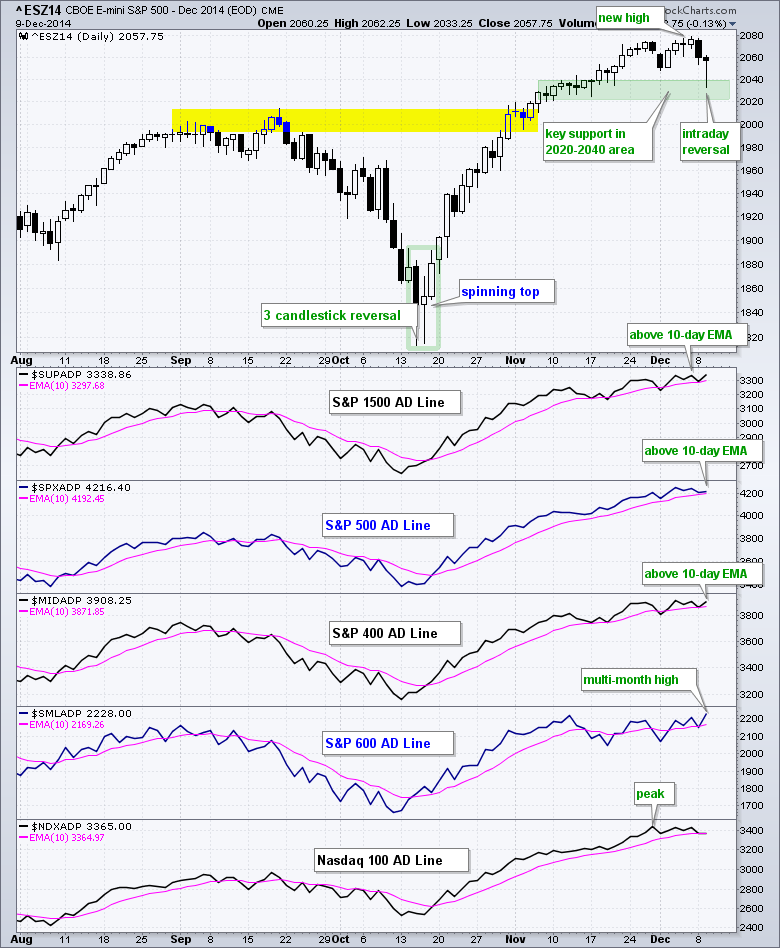
Don’t look now, but the AD Line for the S&P Small-Cap 600 hit a multi-month high and is now the strongest of the five. In addition, the AD Lines for the S&P 1500, S&P 500 and S&P MidCap 400 are above their rising 10-day EMAs. Even though the Nasdaq 100 AD Line is dragging its feet in December, broad market breadth remains bullish and supports the uptrend in stocks.
One risk indicator flipped and now three of the five are bullish. On the positive side, we have the consumer discretionary sector outperforming the consumer staples sector, the equal-weight S&P 500 outperforming the cap-weighted S&P 500 and the 5-year Treasury Yield rising. On the negative side, we have SPY underperforming TLT and the 10-YR Treasury Yield falling. Fundamentally, long-term Treasury bonds are rising and long-term Treasury yields are falling because the market is lowering inflation expectations (blame oil). A disinflationary environment and lower energy costs are net positive for stocks.
SPY fell on Monday and gapped down to support on Tuesday. This gap did not last long as the ETF quickly found its footing and moved right back above 206. This bounce affirms support in the 203-204 area and keeps the short-term uptrend alive.
**************************************************************
QQQ broke the November trend line on Monday and opened in the support zone on Tuesday. This zone held as the ETF bounced back to 105 by the close. The move reinforces support here and keeps the short-term uptrend alive. The indicator window shows Apple bouncing off its support zone and challenging the flag trend line near 115.
**************************************************************
IWM is living up to its bouncy ways. After falling from 118 to 115 in less than two days, the ETF surged right back to above 118 in less than a day. Once again, the ETF is making a breakout bid and even starting to outperform SPY.
**************************************************************
Oil fell some 13% in mid October and this helped fuel a surge in the 20+ YR T-Bond ETF (TLT). Oil is now down around 19% and TLT is up over 3%. The trend is up with support at 120.
**************************************************************
No change. The US Dollar ETF (UUP) toyed with support for a few weeks and then surged to new highs last week. The big trend has been up for a long time and the new high simply affirms this uptrend. The November lows mark key support in the 23.2 area. The Euro Index ($XEU) broke flag support in mid November, bounced and then moved to new lows last week. Key resistance is set at 126.
**************************************************************
No change. The USO Oil Fund (USO) tried to firm, but selling pressure hit again and the ETF hit another new low on Friday. The oversold simply remain oversold and this is testament to the strength of the downtrend. Key resistance remains in the 29 area for now.
**************************************************************
The long-term trend remains down for the Gold SPDR (GLD), but the ETF got a wedge breakout over the last two days and surged to the upper trend line of a rising channel. I would not call this resistance, but it does represent a sort of short-term overbought area. The wedge low marks key support at 114. The indicator window shows the Silver ETF (SLV) also getting a breakout with the surge above 16.
***************************************************************
Key Reports and Events (all times Eastern):
Wed - Dec 10 - 07:00 - MBA Mortgage Index
Wed - Dec 10 - 10:30 - Crude Oil Inventories
Wed - Dec 10 - 14:00 - Treasury Budget
Thu - Dec 11 - 08:30 - Initial Jobless Claims
Thu - Dec 11 - 08:30 - Retail Sales
Thu - Dec 11 - 10:30 - Natural Gas Inventories
Fri - Dec 12 - 08:30 - Producer Price Index (PPI)
Fri - Dec 12 - 09:55 - Michigan Sentiment
Charts of Interest are on Tuesdays and Thursdays.
This commentary and charts-of-interest are designed to stimulate thinking. This analysis is not a recommendation to buy, sell, hold or sell short any security (stock ETF or otherwise). We all need to think for ourselves when it comes to trading our own accounts. First, it is the only way to really learn. Second, we are the only ones responsible for our decisions. Think of these charts as food for further analysis. Before making a trade, it is important to have a plan. Plan the trade and trade the plan. Among other things, this includes setting a trigger level, a target area and a stop-loss level. It is also important to plan for three possible price movements: advance, decline or sideways. Have a plan for all three scenarios BEFORE making the trade. Consider possible holding times. And finally, look at overall market conditions and sector/industry performance.


