Programming note: I will be taking off the rest of the week and Art's Charts will return on Monday, December 29th. Have a great Christmas holiday! It was a mixed day on Wall Street with QQQ closing fractionally higher and IWM closing fractionally lower. Energy and healthcare led the decliners. Oil weighed on the energy sector and biotechs weighed on the healthcare sector. Gilead (GILD), much to my chagrin, failed to hold its diamond breakout and plunged below support with a double-digit decline. The market reacted negatively to a Hep-C pricing deal between AbbVie (ABBV) and ExpressScripts (ESRX). Elsewhere, we saw strength in the Internet ETF (FDN), the Semiconductor SPDR (XSD) and the Networking iShares (IGN). Overall, I remain short-term bullish on US stocks and there were several notable 52-week highs (IWM, SPY, ITOT, PSCC, PSCH, PSCT, RTH, IAI and IYR). I will be doing a Webinar later today (Tuesday) at 1PM ET. I will cover Cyber Security stocks, the gold break down, a big bearish pattern in a key oil stock, creating an ETF component list and Q&A. Click here to register.
**This chart analysis is for educational purposes only, and should not
be construed as a recommendation to buy, sell or sell-short said securities**
Short-term Overview (Tuesday, 23-December-2014):
- Breadth is bullish with four of the five AD Lines hitting new highs.
- Four of the five risk indicators remain positive for stocks.
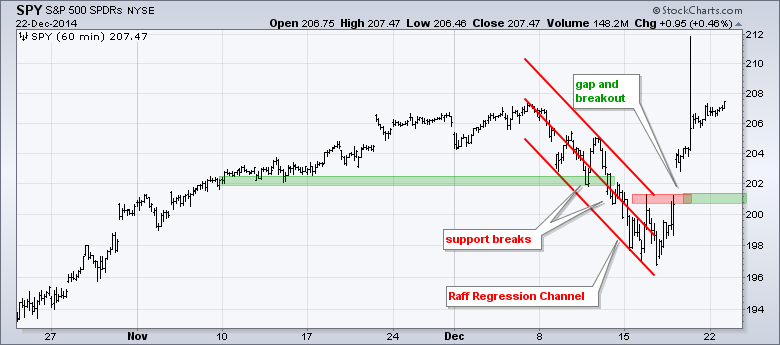
- SPY broke out with a gap-surge on 18-Dec and first support is set in the 201 area.
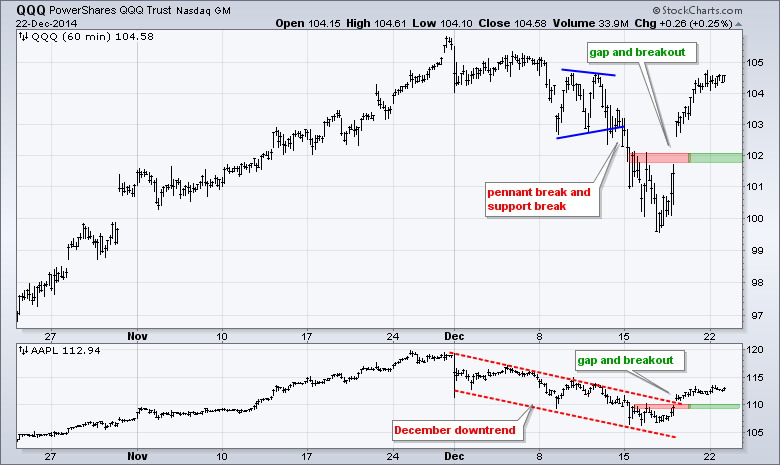
- QQQ broke out with a gap-surge on 18-Dec and first support is set in the 102 area.
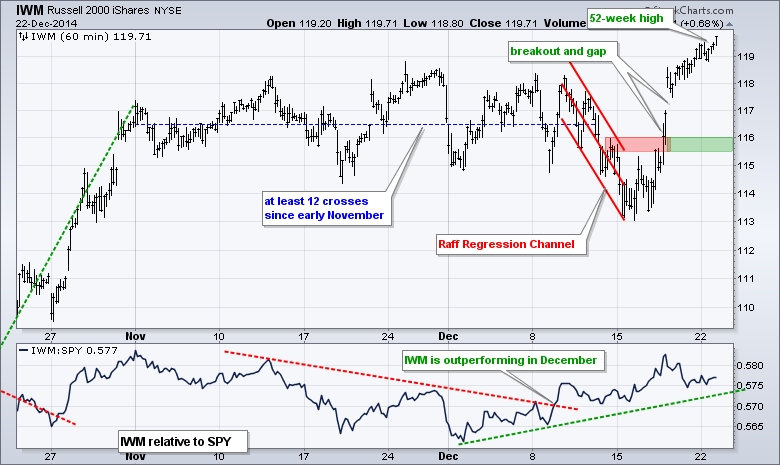
- IWM broke out with a surge on 17-Dec and first support is set in the 116 area.
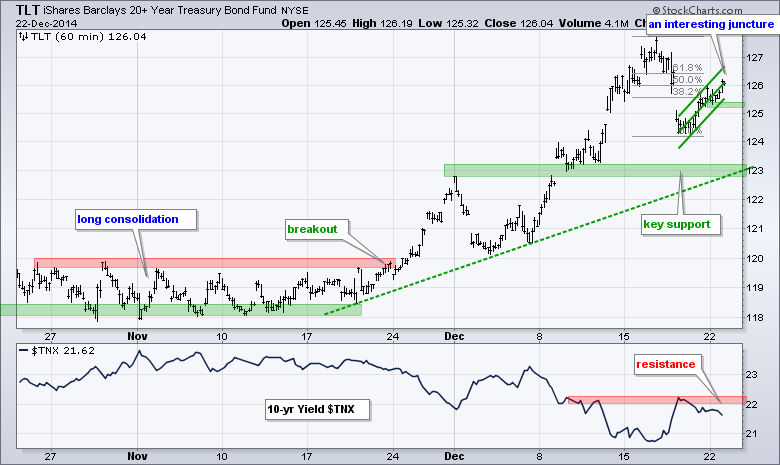
- TLT bounced to a key retracement zone and I raised key support to the 123 area.
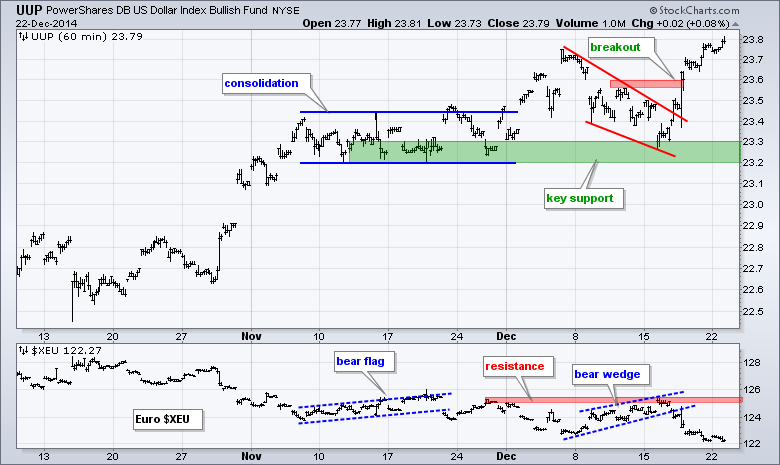
- UUP got a wedge breakout and the Euro got a wedge break down to continue their respective trends.
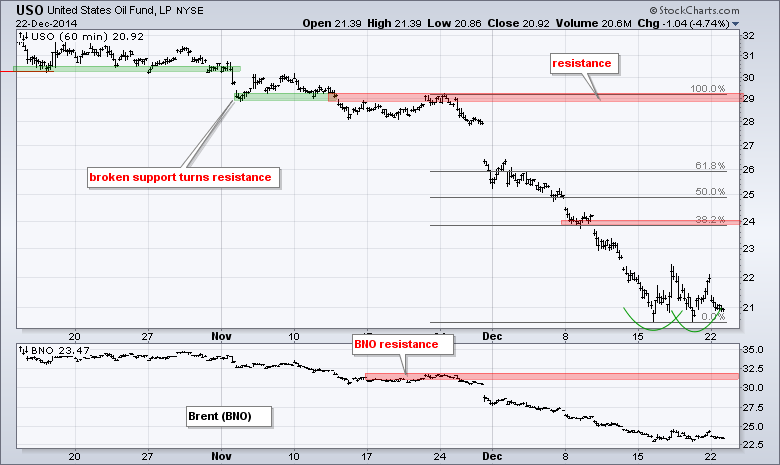
- USO is firming and could be poised for an oversold bounce to the 38% retracement.
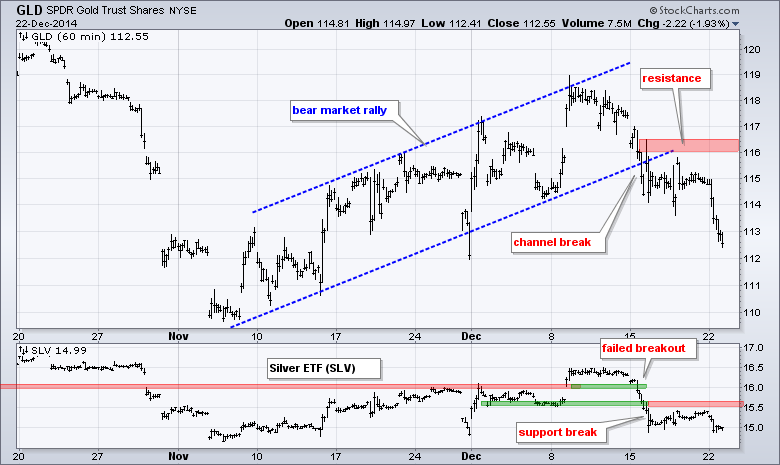
- GLD broke channel support on 15-Dec and the support break turns first resistance in the 116-116.5 area.
The March E-mini S&P 500 (^ESH15) closed at a new high to extend its uptrend. There is no real change on the chart as broken resistance turns first support in the 2000-2020 area.
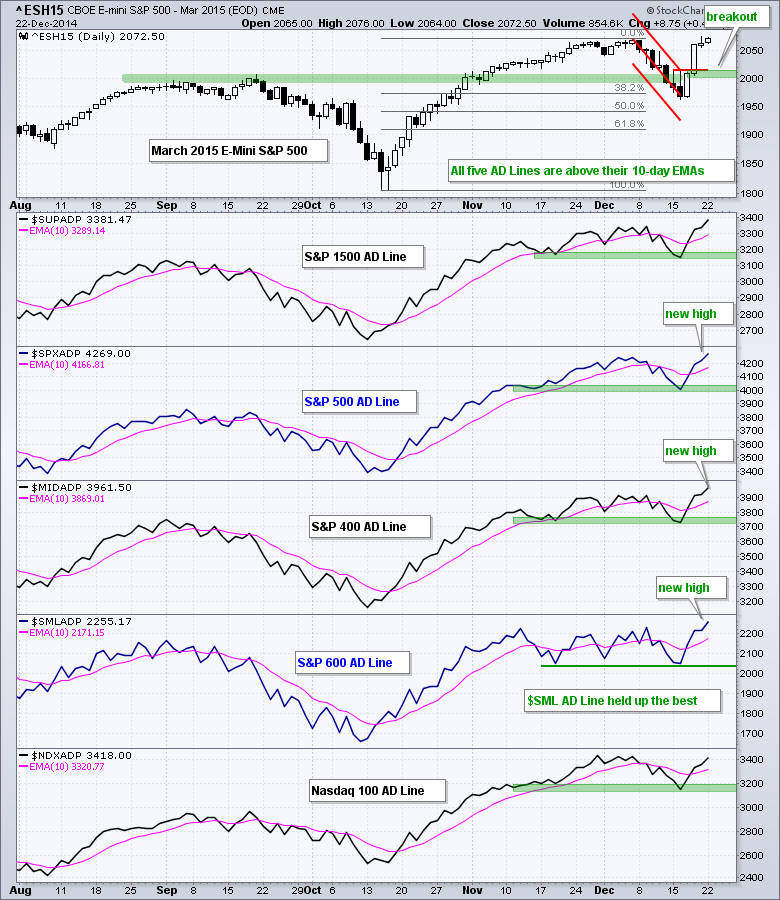
Short-term breadth is bullish and got even more bullish as the AD Lines for the S&P 1500, S&P 500, S&P MidCap 400 and S&P Small-Cap 600 broke above their prior highs. Fresh highs in these four AD Lines reflect broad strength in the stock market. The Nasdaq 100 AD Line has yet to break above its late November high and is lagging somewhat.
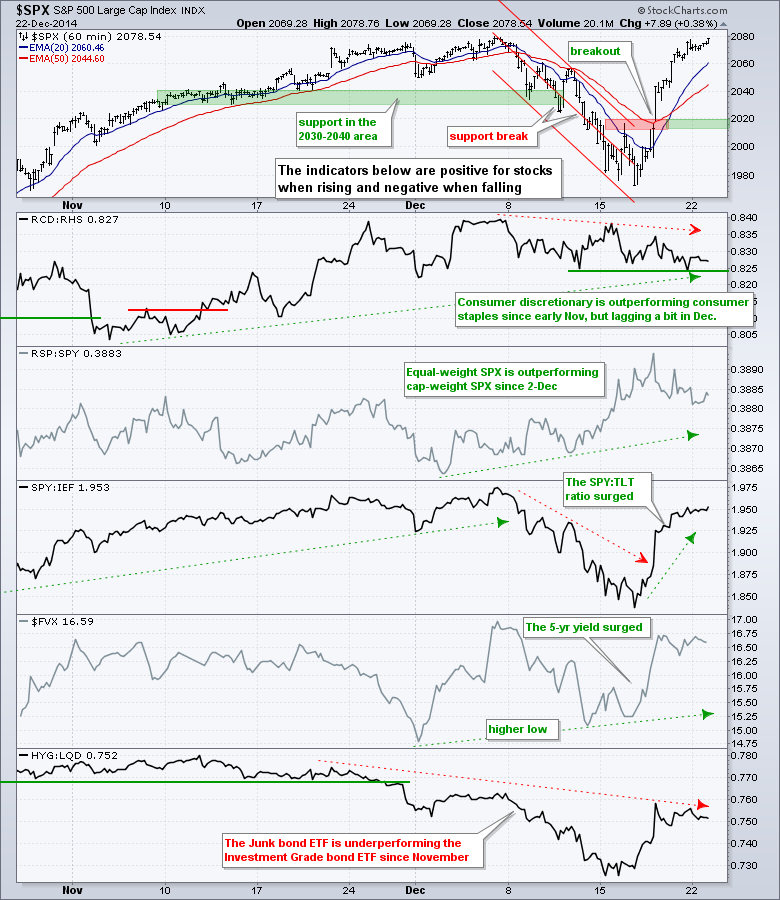
Four of the five short-term risk indicators are bullish (green) and there is no real change on this chart. I am a bit concerned that the consumer discretionary sector is dragging its feet in December, but relative weakness is partly because the Equal-Weight Consumer Staples ETF (RHS) surged more than the Equal-Weight Consumer Discretionary ETF (RCD). Note that RCD and XLY hit new highs on Monday and are by no means weak.
No change. SPY gapped above resistance and broke out with a strong move last week. All data vendors have the spike to 212 so we will have to live with it. The gap and broken resistance mark first support in the 201 area.
**************************************************************
No change. QQQ broke out with a gap and surge above 103 last week. This gap is bullish as long as it remains unfilled. A move below 101.8 would fill the gap and suggest that the breakout has failed. Apple also broke out with a gap and I would mark first support at 109.
**************************************************************
No change. IWM was the first to break out and even exceeded its late November high last week. Broken resistance turns first support in the 115.5-116 area. IWM has been outperforming SPY since early December and the "January" effect is living up to its name so far.
**************************************************************
The 20+ YR T-Bond ETF (TLT) fell sharply after the Fed meeting last week and then bounced back to the 50-62% retracement zone. This puts TLT at a possible reversal zone, but keep in mind this is very short-term trading because the bounce was just a few days. A move below Monday's low would be negative and signal a continuation of last week's plunge. I am now marking key support in the 123 area. The indicator window shows the 10-YR Treasury Yield ($TNX) with resistance in the 2.23% area (22.3 on the scale).
**************************************************************
No change. The US Dollar ETF (UUP) held support and surged above resistance at 23.6 to signal a continuation of the uptrend. This move reinforces support in the 23.2-23.3 area. The Euro Index ($XEU) failed at resistance and broke wedge support with a sharp decline. Resistance is marked at 125.50.
**************************************************************
No change. The USO Oil Fund (USO) firmed in the 21-22 area last week and has a small double bottom taking shape. An oversold bounce from here would be quite normal, provided the news-flow remains benign. As we saw over the last several weeks, Saudi Arabia is the swing producer and holds all the trump cards when it comes to oil. Medium and long-term, one would need to get into the head of the Saudis to predict the future price of oil. For levels, I would mark first resistance near the 38% retracement in the 24 area.
**************************************************************
No change. The Gold SPDR (GLD) advanced from 110 to 119 with a rising channel and broke channel support with a sharp decline below 116. The long-term trend is down and this channel was viewed as a bear-market rally. The channel break down is holding with first resistance marked in the 116-116.5 area. The indicator window shows the Silver ETF (SLV) also breaking down and staying down.
***************************************************************
Key Reports and Events (all times Eastern):
Mon - Dec 22 - 10:00 - Existing Home Sales
Tue - Dec 23 - 08:30 - Durable Goods Orders
Tue - Dec 23 - 08:30 - Personal Income & Spending
Tue - Dec 23 - 08:30 - PCE Prices
Tue - Dec 23 - 08:30 - GDP
Tue - Dec 23 - 09:00 - FHFA Housing Price Index
Tue - Dec 23 - 09:55 - Michigan Sentiment
Tue - Dec 23 - 10:00 - New Home Sales
Wed - Dec 24 - 07:00 - MBA Mortgage Index
Wed - Dec 24 - 08:30 - Initial Jobless Claims
Wed - Dec 24 - 10:30 - Crude Oil Inventories
Wed - Dec 24 - 12:00 - Natural Gas Inventories
Charts of Interest will be incorporated into the Market Message and Webinar on Tuesdays.
This commentary and charts-of-interest are designed to stimulate thinking. This analysis is not a recommendation to buy, sell, hold or sell short any security (stock ETF or otherwise). We all need to think for ourselves when it comes to trading our own accounts. First, it is the only way to really learn. Second, we are the only ones responsible for our decisions. Think of these charts as food for further analysis. Before making a trade, it is important to have a plan. Plan the trade and trade the plan. Among other things, this includes setting a trigger level, a target area and a stop-loss level. It is also important to plan for three possible price movements: advance, decline or sideways. Have a plan for all three scenarios BEFORE making the trade. Consider possible holding times. And finally, look at overall market conditions and sector/industry performance.
