Stocks started the week with selling pressure, but the bulls found their footing on Wednesday and produced a strong two-day surge. The Russell 2000 iShares (+3.65%) and Russell MicroCap iShares (+4.09%) led the charge and both have been outperforming the S&P 500 SPDR (SPY) this month. This is positive and shows an appetite for risk in the broader market. Energy stocks were the big winners and got oversold bounces on short-covering and bargain hunting. The High Yield Bond SPDR (JNK) also rebounded. I do not think a long-term bottom is in place for oil or energy stocks, but this oversold bounce could extend and give life to the broader stock market. The market likes lower oil prices, but not too low. Outside of energy, we saw relative strength in the Networking iShares (IGN), the SmallCap Technology ETF (PSCT), the Broker-Dealer iShares (IAI) and the Biotech SPDR (XBI).
**This chart analysis is for educational purposes only, and should not
be construed as a recommendation to buy, sell or sell-short said securities**
Short-term Overview (Monday, 22-December-2014):
- Breadth is bullish with the S&P MidCap 400 showing the most strength.
- Four of the five risk indicators are positive and stocks started outperforming bonds.
- SPY broke out with a gap-surge on 18-Dec and first support is set in the 201 area.
- QQQ broke out with a gap-surge on 18-Dec and first support is set in the 102 area.
- IWM broke out with a surge on 17-Dec and first support is set in the 116 area.
- TLT fell and bounced to establish first support in the 124 area.
- UUP got a wedge breakout and the Euro got a wedge break down to continue their respective trends.
- USO is firming and could be poised for an oversold bounce to the 38% retracement.
- GLD broke channel support on 15-Dec and the support break turns first resistance in the 116-116.5 area.
The March E-mini S&P 500 (^ESH15) broke out with a big move on Wednesday-Thursday and then stalled on Friday. A stall after a big surge is normal and represents a rest. Broken resistance turns first support to watch should a pullback unfold.
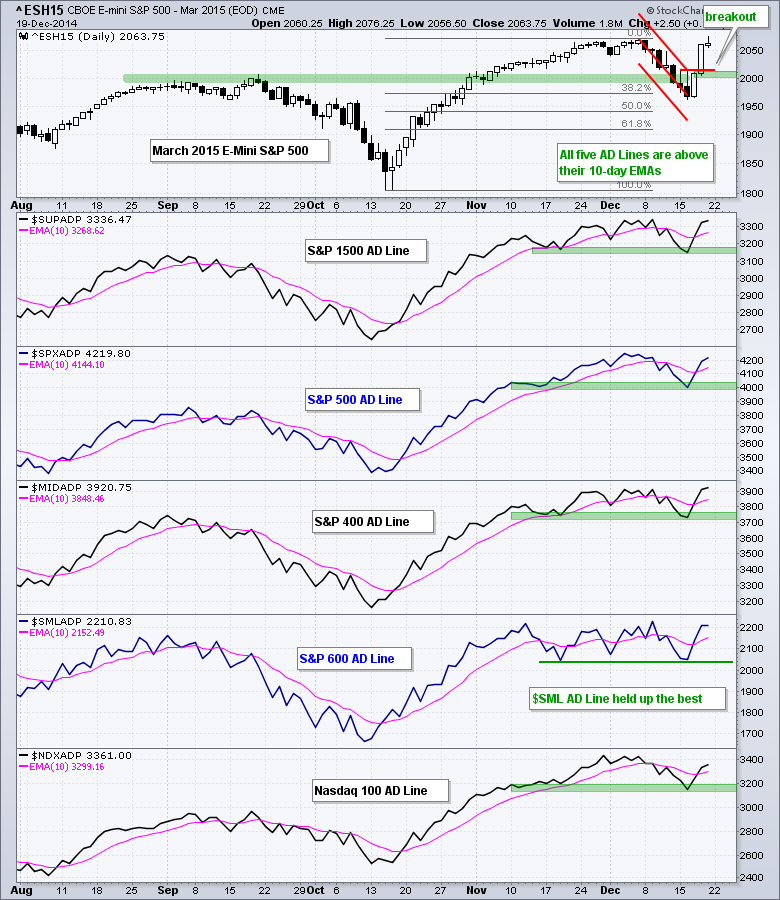
Short-term breadth is bullish. The S&P MidCap 400 AD Line hit a new high with its surge over the last few days and is the strongest. The S&P Small-Cap 600 and S&P 1500 AD Lines are near their early December highs and challenging. The Nasdaq 100 AD Line is lagging a bit, but still got a bounce and moved above the 10-day EMA.
Four of the five short-term risk indicators are bullish (green). Of note, the consumer discretionary sector is still outperforming the consumer staples sector since early November, but it has been lagging the last two weeks. I will be watching this one closely in the coming days. Stocks also started outperforming bonds as the SPY:TLT ratio and 5-year Treasury Yield ($FVX) surged.

SPY gapped above resistance and broke out with a strong move last week. All data vendors have the spike to 212 so we will have to live with it. The gap and broken resistance mark first support in the 201 area.

**************************************************************
QQQ broke out with a gap and surge above 103 last week. This gap is bullish as long as it remains unfilled. A move below 101.8 would fill the gap and suggest that the breakout has failed. Apple also broke out with a gap and I would mark first support at 109.

**************************************************************
IWM was the first to break out and even exceeded its late November high last week. Broken resistance turns first support in the 115.5-116 area. IWM has been outperforming SPY since early December and the "January" effect is living up to its name so far.

**************************************************************
The 20+ YR T-Bond ETF (TLT) fell sharply after the Fed meeting, but rebounded on Friday to establish first support in the 124 area. This bounce also occurred near the 38% retracement. The long-term trend for TLT is still up so I will leave key support at 120 for now.

**************************************************************
The US Dollar ETF (UUP) held support and surged above resistance at 23.6 to signal a continuation of the uptrend. This move reinforces support in the 23.2-23.3 area. The Euro Index ($XEU) failed at resistance and broke wedge support with a sharp decline. Resistance is marked at 125.50

**************************************************************
The USO Oil Fund (USO) firmed in the 21-22 area last week and has a small double bottom taking shape. An oversold bounce from here would be quite normal, provided the news-flow remains benign. As we saw over the last several weeks, Saudi Arabia is the swing producer and holds all the trump cards when it comes to oil. Medium and long-term, one would need to get into the head of the Saudi's to predict the future price of oil. For levels, I would mark first resistance near the 38% retracement in the 24 area.

**************************************************************
The Gold SPDR (GLD) advanced from 110 to 119 with a rising channel and broke channel support with a sharp decline below 116. The long-term trend is down and this channel was viewed as a bear-market rally. The channel break down is holding with first resistance marked in the 116-116.5 area. The indicator window shows the Silver ETF (SLV) also breaking down and staying down.

***************************************************************
Key Reports and Events (all times Eastern):
Mon - Dec 22 - 10:00 - Existing Home Sales
Tue - Dec 23 - 08:30 - Durable Goods Orders
Tue - Dec 23 - 08:30 - Personal Income & Spending
Tue - Dec 23 - 08:30 - PCE Prices
Tue - Dec 23 - 08:30 - GDP
Tue - Dec 23 - 09:00 - FHFA Housing Price Index
Tue - Dec 23 - 09:55 - Michigan Sentiment
Tue - Dec 23 - 10:00 - New Home Sales
Wed - Dec 24 - 07:00 - MBA Mortgage Index
Wed - Dec 24 - 08:30 - Initial Jobless Claims
Wed - Dec 24 - 10:30 - Crude Oil Inventories
Wed - Dec 24 - 12:00 - Natural Gas Inventories
Charts of Interest will be incorporated into the Market Message and Webinar on Tuesdays.
This commentary and charts-of-interest are designed to stimulate thinking. This analysis is not a recommendation to buy, sell, hold or sell short any security (stock ETF or otherwise). We all need to think for ourselves when it comes to trading our own accounts. First, it is the only way to really learn. Second, we are the only ones responsible for our decisions. Think of these charts as food for further analysis. Before making a trade, it is important to have a plan. Plan the trade and trade the plan. Among other things, this includes setting a trigger level, a target area and a stop-loss level. It is also important to plan for three possible price movements: advance, decline or sideways. Have a plan for all three scenarios BEFORE making the trade. Consider possible holding times. And finally, look at overall market conditions and sector/industry performance.


