Stocks fell sharply last week as the S&P 500 suffered its largest weekly decline since May 2012. This was also the fifth weekly decline greater than 2.5% this year. Note that the prior four declines did not derail the bull market because the S&P 500 went on to new highs after each thumping. The long-term trend remains up for the S&P 500 and Nasdaq 100. The long-term trend for the Russell 2000 could be considered flat because the index has gone nowhere this year. The Russell 2000, however, is outperforming the S&P 500 in December and did hold support from the November lows. I remain with a short-term bullish bias on stocks because IWM and QQQ did not break short-term support, the AD Lines are holding up and the two stock-related risk indicators are positive.
**This chart analysis is for educational purposes only, and should not
be construed as a recommendation to buy, sell or sell-short said securities**
Short-term Overview (Monday, 15-December-2014):
- The AD Lines moved below their 10-day EMAs, but remain in uptrends overall and have yet to break their support zones.
- The three bond-related risk indicators are negative, but the two stock specific indicators are positive.
- SPY is in a five day downtrend, but near next support in the 200 area and short-term oversold.
- QQQ broke pennant support, but has yet to break the bigger support zone extending back to mid November.
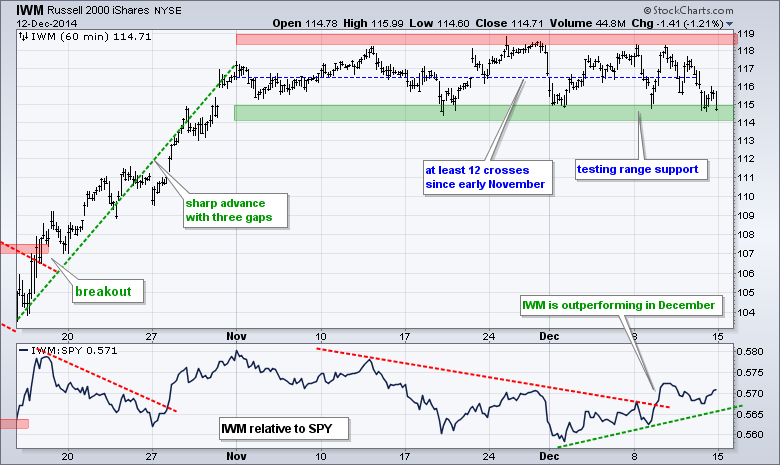
- IWM is testing range support for the umpteenth time.
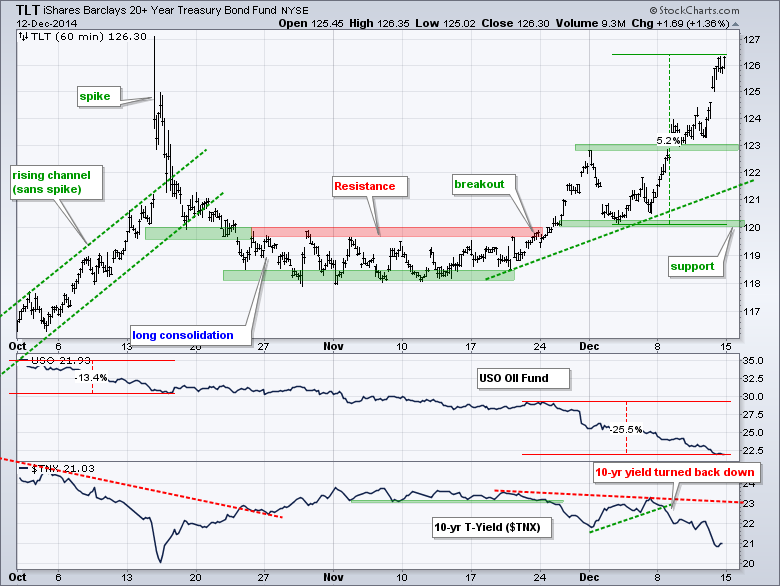
- TLT extended its uptrend and key support remains at 120.
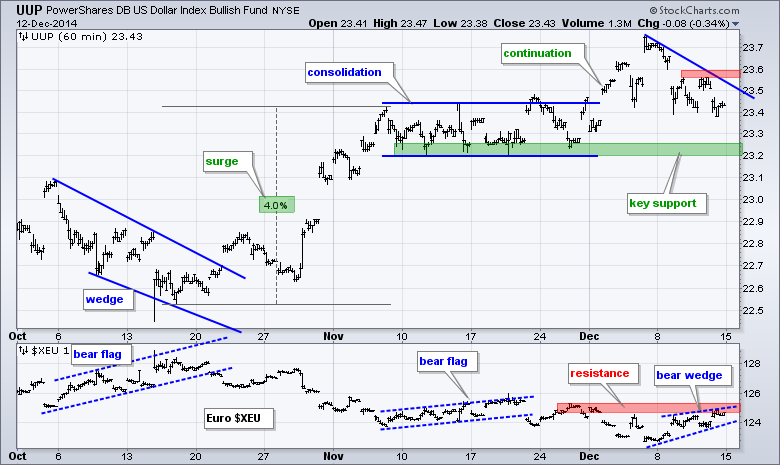
- UUP fell back last week and the Euro bounced, but the Euro is nearing resistance.
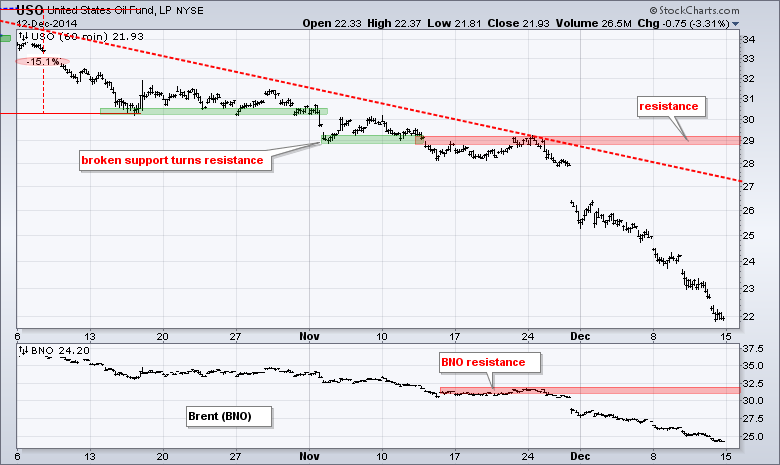
- USO remains in a strong downtrend.
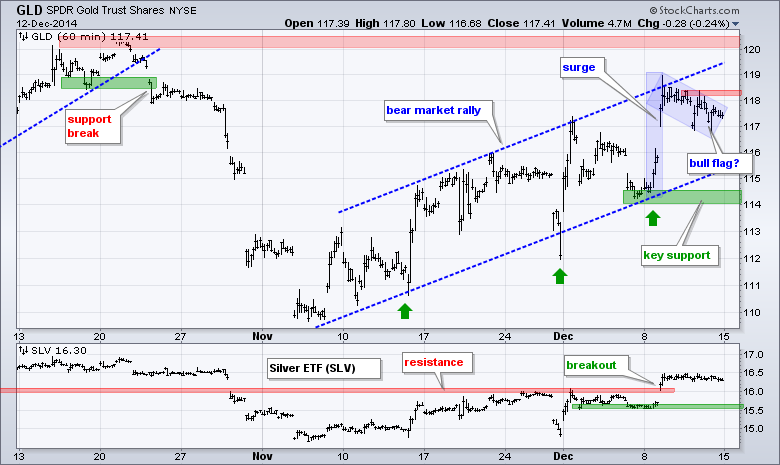
- GLD is in the midst of a five-week bear market rally, but did not break flag resistance or move higher on Friday.
The December E-mini S&P 500 (^ESZ14) fell sharply three of the last five days and broke below the mid November low. Despite this break, the bigger trend is up, the E-mini is short-term oversold and there is possible support in the 2000 area.
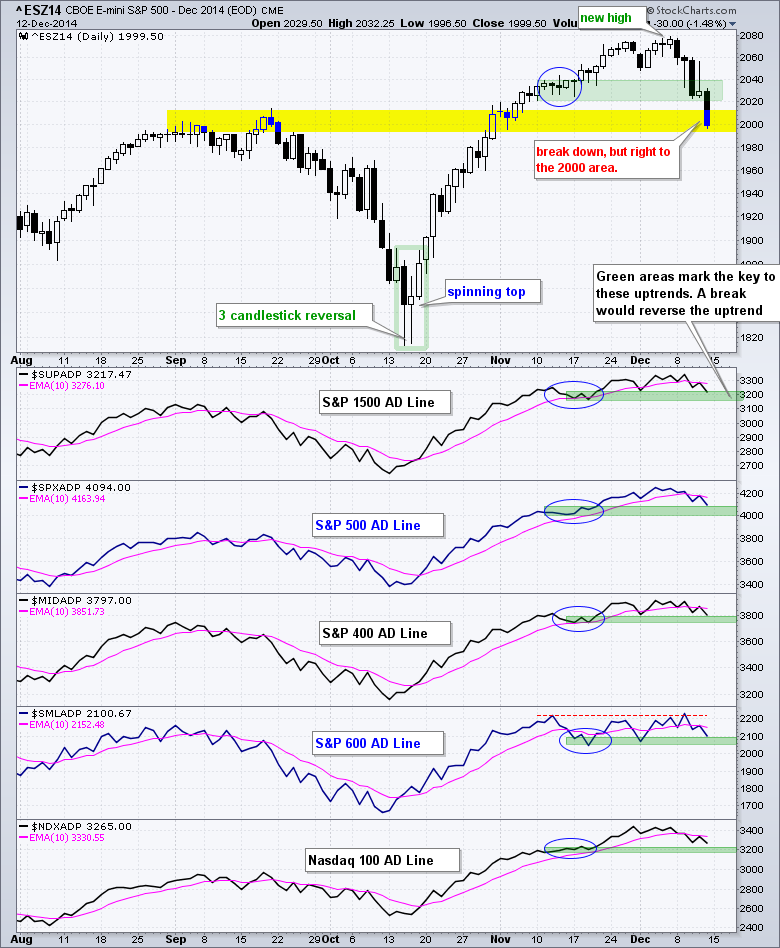
Breadth is a tough call because all five AD Lines are below their 10-day EMAs, but they remain above their mid November lows. The blue ovals mark the mid November lows for the E-mini and the five AD Lines. The S&P 1500, S&P 500, S&P MidCap 400 and S&P Small-Cap 600 broke their mid November lows, but their respective AD Lines did not. This tells me that breadth is holding up better than the underlying indices. The AD Line for the S&P Small-Cap 600 is holding up the best because it exceeded its mid November high last week and remains above the early December low.
Despite a sharp decline on Friday, the risk indicators remain unchanged. The two stock-related indicators are positive with the consumer discretionary sector outperforming the consumer staples sector since early November and the equal-weight S&P 500 outperforming the cap-weighted S&P 500 since 2-December. The three bond-related indicators are negative (risk off). SPY is underperforming TLT since late November, the 5-year Treasury Yield ($FVX) turned down over the last six days and Junk bonds are underperforming Investment-Grade bonds.
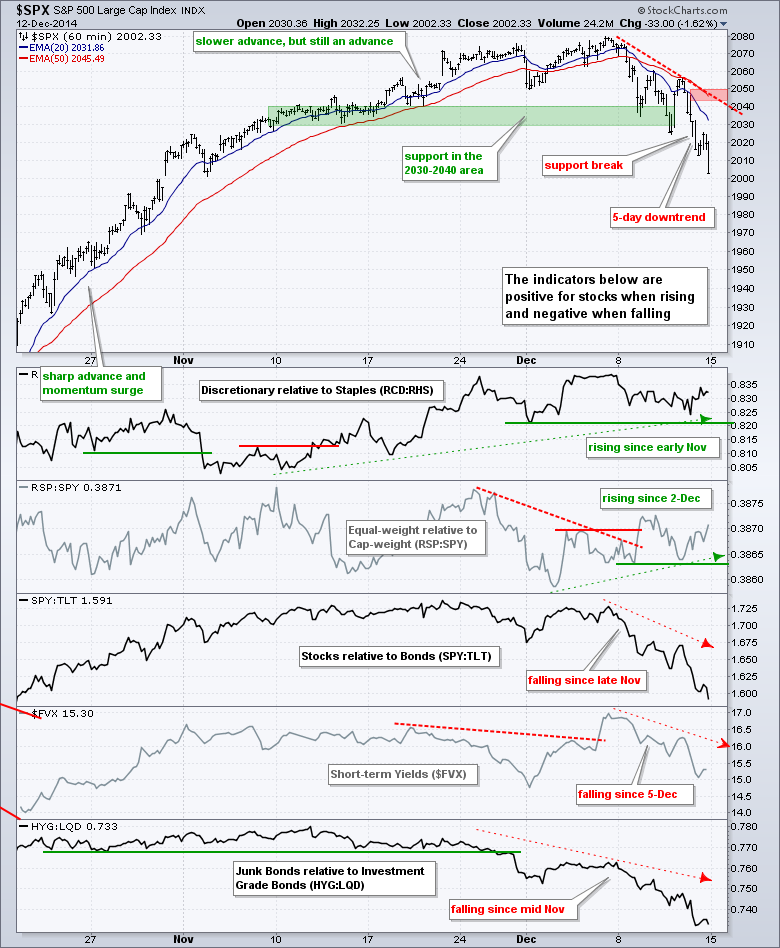
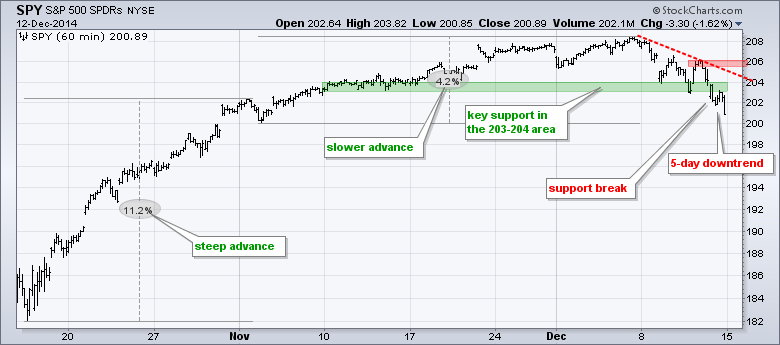
SPY advanced 4.2% from early November to early December and then wiped this gain out with a sharp decline last week. The price action indicates that the short-term trend is down after a support break and lower-low lower-high sequence last week. Despite this downtrend, the bigger trend is up and the S&P 500 is near the 2000 area (SPY 200).
**************************************************************
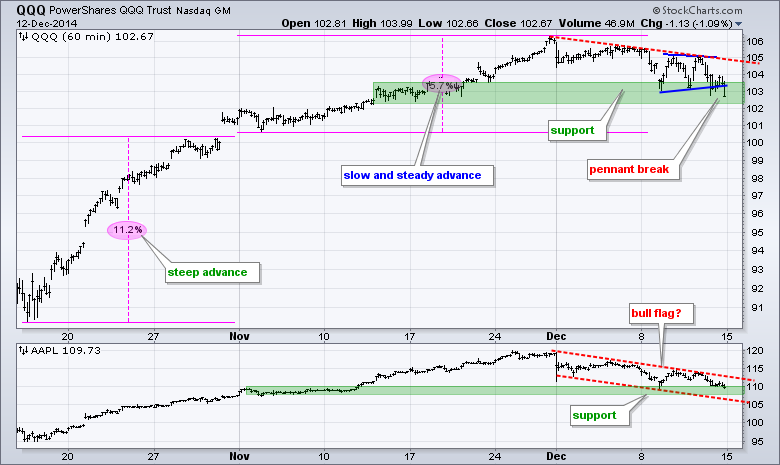
QQQ broke pennant support with a close below 103, but remains within the bigger support zone (102.5-103.5). The December trend is down (two weeks) with resistance set at 105. Apple is holding up well, but also remains in a December downtrend. Resistance is set at 114.
**************************************************************
IWM is perhaps the most interesting of the three because it is testing support and showing relative strength in December. The ETF was also holding up well on Friday, but got slammed in the final hour to close below 115. Nevertheless, range support is holding so far.
**************************************************************
Oil is down around 25% in the last three weeks and the 20+ YR T-Bond ETF (TLT) is up around 5% in less than two weeks. Treasury bonds are benefitting from lower expectations for inflation and a flight to safety in the bond market. The decline in oil weighed on the junk bond market. On the TLT chart, broken resistance turns first support in the 123 area. Key support remains in the 120 area for now.
**************************************************************
The US Dollar ETF (UUP) fell back last week, but the bigger trend is up and this is viewed as a correction. A break above 23.60 would signal a continuation higher. The Euro Index ($XEU) bounced last week and formed a rising wedge, which looks like a bear market rally. A break below 124 would signal a continuation lower.
**************************************************************
The USO Oil Fund (USO) remains in a strong downtrend.
**************************************************************
The Gold SPDR (GLD) surged early last week and then formed falling flag the last four days. I expected a breakout given the turmoil in the stock market and surge in the bond market, but it did not happen. Hmm....this could be negative. Flag resistance remains at 118.5. Overall, the five week advance is still considered a bear market rally because the long-term trend is down. Key support is set at 114.
***************************************************************
Key Reports and Events (all times Eastern):
Mon - Dec 15 - 08:30 - Empire Manufacturing
Mon - Dec 15 - 09:15 - Industrial Production
Mon - Dec 15 - 10:00 - NAHB Housing Market Index
Tue - Dec 16 - 08:30 - Housing Starts & Building Permits
Wed - Dec 17 - 07:00 - MBA Mortgage Index
Wed - Dec 17 - 08:30 - Consumer Price Index (CPI)
Wed - Dec 17 - 10:30 - Crude Oil Inventories
Wed - Dec 17 - 14:00 - FOMC Policy Statement
Thu - Dec 18 - 08:30 - Initial Jobless Claims
Thu - Dec 18 - 10:00 - Philadelphia Fed
Thu - Dec 18 - 10:00 - Leading Economic Indicators
Thu - Dec 18 - 10:30 - Natural Gas Inventories
Charts of Interest are on Tuesdays and Thursdays. Sorry, none today.
This commentary and charts-of-interest are designed to stimulate thinking. This analysis is not a recommendation to buy, sell, hold or sell short any security (stock ETF or otherwise). We all need to think for ourselves when it comes to trading our own accounts. First, it is the only way to really learn. Second, we are the only ones responsible for our decisions. Think of these charts as food for further analysis. Before making a trade, it is important to have a plan. Plan the trade and trade the plan. Among other things, this includes setting a trigger level, a target area and a stop-loss level. It is also important to plan for three possible price movements: advance, decline or sideways. Have a plan for all three scenarios BEFORE making the trade. Consider possible holding times. And finally, look at overall market conditions and sector/industry performance.


