Even though correlation is not always causation, selling pressure extended in stocks and oil got the blame. Light Crude Futures (^CLF15) fell another 3+ percent and hit $55.02 on the low. Stocks, and oil, got an early bounce Monday morning, but buying pressure soon dissipated and prices turned lower. All sector SPDRs were down, but the losses were relatively modest. Finance, healthcare and utilities led with declines that were near .90%. Retail stocks provided a bright spot as the Retail SPDR (XRT) and MarketVectors Retail ETF (RTH) gained. One group's gain is another group's loss. The plunge in oil prices is positive for retail spending, airlines and truckers. The Networking iShares (IGN) and the Semiconductor SPDR (XSD) also held up relatively well in the tech sector. Overall, IWM and QQQ joined SPY with short-term support breaks and this means the majority of short-term trends are down. Even though the AD Lines are at support and stocks are short-term oversold, this pullback should be considered a short-term downtrend and I put resistance levels in place.
**This chart analysis is for educational purposes only, and should not
be construed as a recommendation to buy, sell or sell-short said securities**
Short-term Overview (Tuesday, 16-December-2014):
- The AD Lines are below their 10-day EMAs and testing their support zones.
- The three bond-related risk indicators are negative, but the two stock specific indicators are positive.
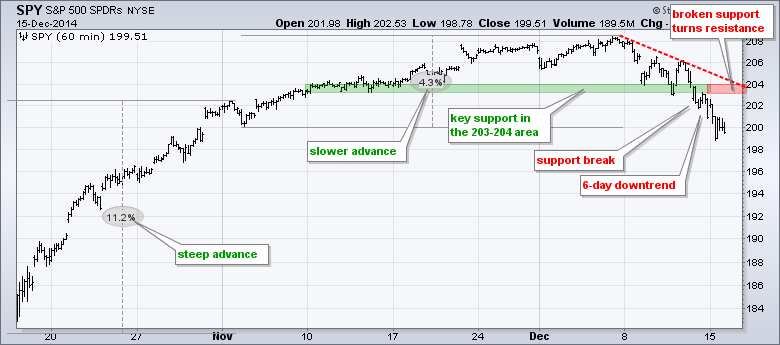
- SPY broke support and broken support turns resistance in the 203-204 area.
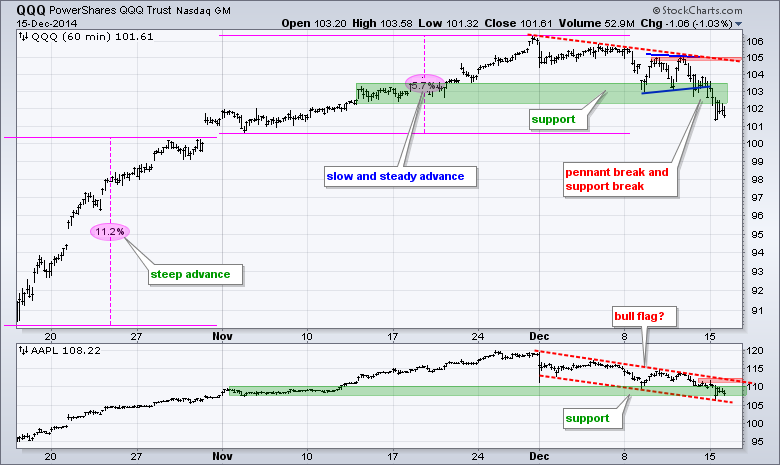
- QQQ broke support with a move below 102.5 and resistance is set at 105.
- IWM broke range support and downswing resistance is set at 116.
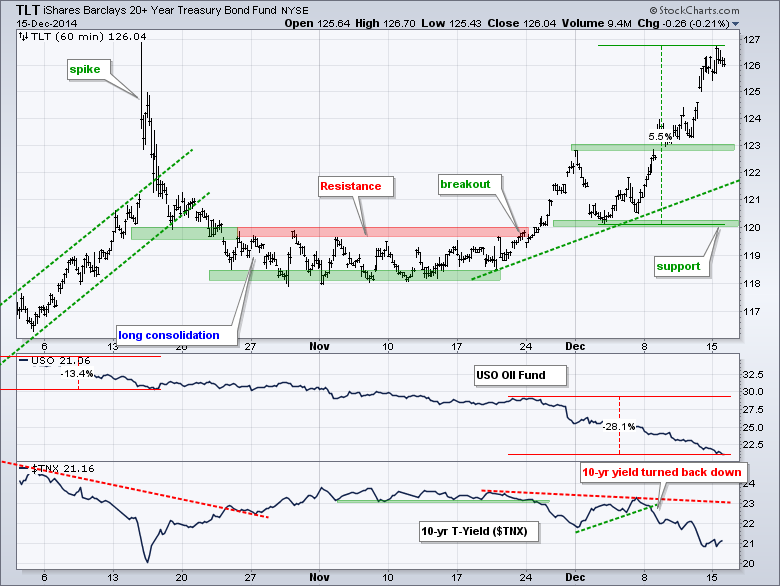
- TLT continues to outperform SPY and support is set at 120.
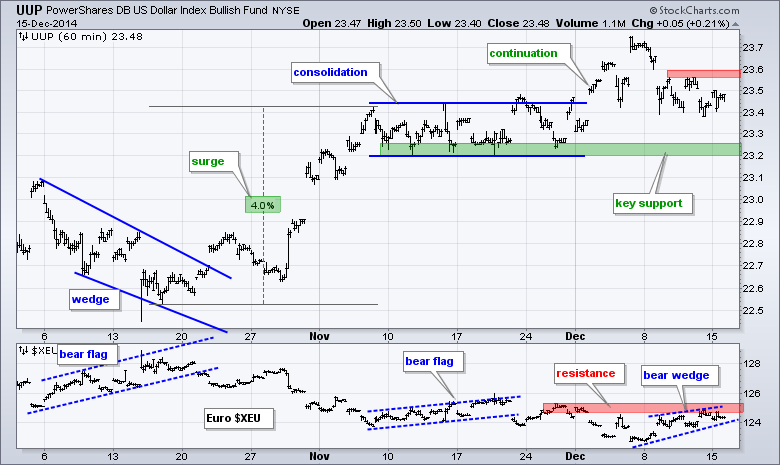
- UUP fell back and the Euro bounced, but the Euro is nearing resistance.
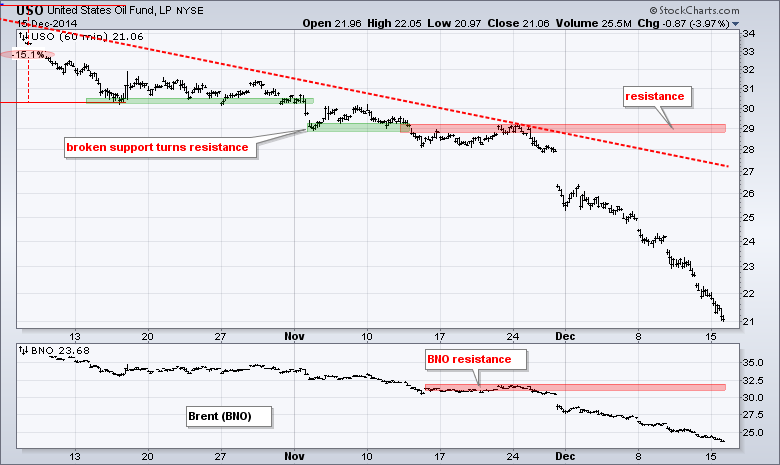
- USO remains in a strong downtrend.
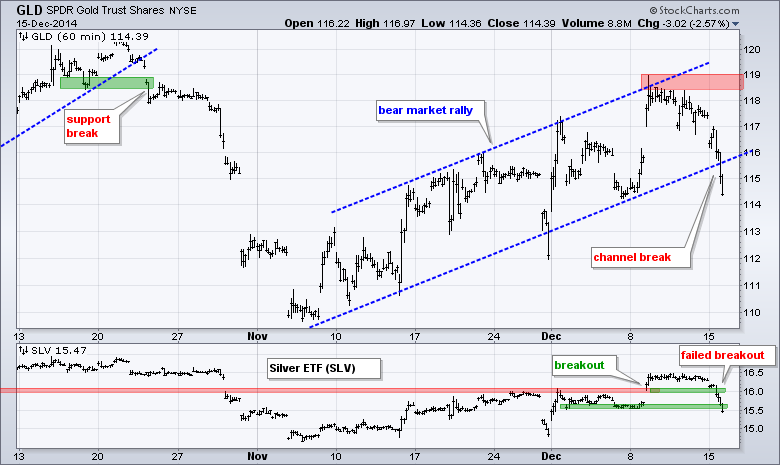
- GLD broke channel support with a sharp decline and this signals a continuation of the long-term downtrend.
The December E-mini S&P 500 (^ESZ14) fell sharply over the last six days and broke below 2000. The decline is sharp and I am using a short Raff Regression Channel to define the descent. The upper trend line and Friday's high mark resistance at 2030.
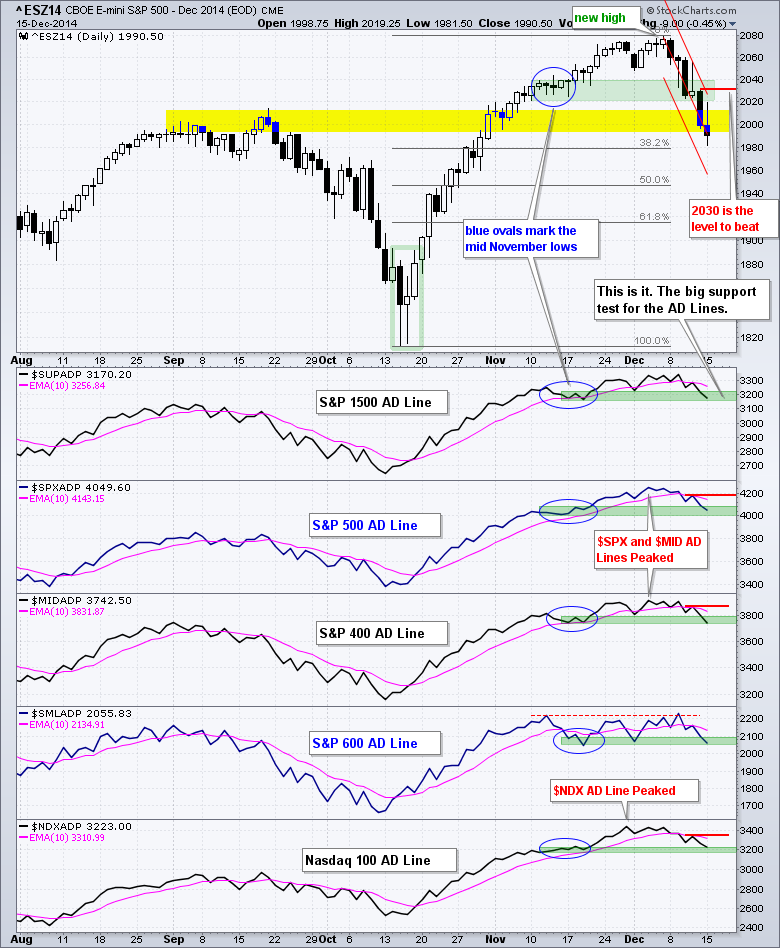
The AD Lines are at their moment of truth (green support zones). The decline over the last six days has been heavy in price, but not so much in breadth. Nevertheless, the Nasdaq 100 AD Line has been falling since 28-Nov, while the S&P 500 and S&P MidCap 400 AD Lines have been falling since 3-Dec. The E-mini peaked on 5-Dec. A break above Friday's high is needed to reverse the short-term decline in these AD Lines.
The risk indicators remain unchanged. The two stock-related indicators are positive with the consumer discretionary sector outperforming the consumer staples sector since early November and the equal-weight S&P 500 outperforming the S&P 500 since 2-December. The three bond-related indicators are negative (risk off). SPY is underperforming TLT since late November, the 5-year Treasury Yield ($FVX) turned down over the last seven days and Junk bonds are seriously underperforming Investment-Grade bonds.
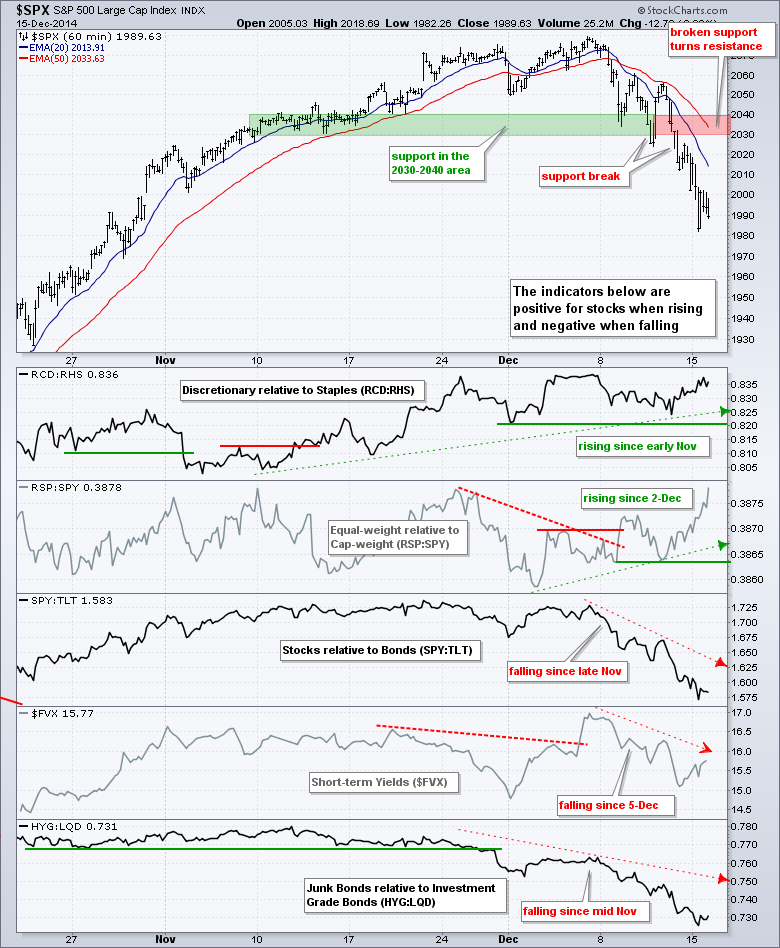
SPY broke support in the 203-204 area and continued below 200 on Monday. The six day trend is down and broken support turns first resistance at 204.
**************************************************************
QQQ broke pennant support on Friday and continued below 102 on Monday to break its support zone. The early December trend line and last week's highs mark resistance at 105. Apple continues to work its way lower and I am marking resistance at 112.
**************************************************************
IWM is still holding up better than SPY, but the ETF broke support with a move below 114 on Monday. A short Raff Regression Channel marks the current downswing with resistance set at 116

**************************************************************
No change. Oil is down around 25+ percent the last three weeks and the 20+ YR T-Bond ETF (TLT) is up around 5.5% in two weeks. The decline in oil also weighed on the junk bond market. Treasury bonds are benefitting from lower expectations for inflation and a flight to safety in the bond market. On the TLT chart, broken resistance turns first support in the 123 area. Key support remains in the 120 area for now.
**************************************************************
No change. The US Dollar ETF (UUP) fell back last week, but the bigger trend is up and this is viewed as a correction. A break above 23.60 would signal a continuation higher. The Euro Index ($XEU) bounced last week and formed a rising wedge, which looks like a bear market rally. A break below 124 would signal a continuation lower.
**************************************************************
No change. The USO Oil Fund (USO) remains in a strong downtrend.
**************************************************************
The Gold SPDR (GLD) had a flag working last week and had every chance to breakout, but did not and moved sharply lower on Monday. This move broke the lower trend line of a rising channel and erased last week's surge. With the bigger trend down, this looks like a continuation breakdown and a move to new lows is expected.
***************************************************************
Key Reports and Events (all times Eastern):
Tue - Dec 16 - 08:30 - Housing Starts & Building Permits
Wed - Dec 17 - 07:00 - MBA Mortgage Index
Wed - Dec 17 - 08:30 - Consumer Price Index (CPI)
Wed - Dec 17 - 10:30 - Crude Oil Inventories
Wed - Dec 17 - 14:00 - FOMC Policy Statement
Thu - Dec 18 - 08:30 - Initial Jobless Claims
Thu - Dec 18 - 10:00 - Philadelphia Fed
Thu - Dec 18 - 10:00 - Leading Economic Indicators
Thu - Dec 18 - 10:30 - Natural Gas Inventories
Charts of Interest are on Tuesdays and Thursdays.
This commentary and charts-of-interest are designed to stimulate thinking. This analysis is not a recommendation to buy, sell, hold or sell short any security (stock ETF or otherwise). We all need to think for ourselves when it comes to trading our own accounts. First, it is the only way to really learn. Second, we are the only ones responsible for our decisions. Think of these charts as food for further analysis. Before making a trade, it is important to have a plan. Plan the trade and trade the plan. Among other things, this includes setting a trigger level, a target area and a stop-loss level. It is also important to plan for three possible price movements: advance, decline or sideways. Have a plan for all three scenarios BEFORE making the trade. Consider possible holding times. And finally, look at overall market conditions and sector/industry performance.


