Stocks ended the year weak and started the year weak with Greece and oil getting most of the blame. Light Crude fell below $50 and energy stocks got hammered. European stocks plunged on fears of a Greek exit, and Japan followed suit today with a 3% decline. I am not sure how Japan is connected with Greece and oil, but I guess it seems normal to follow suit. With a sharp four day decline, stocks are oversold and ripe for a bounce. Even so, risk-off is definitely in the air right now because Treasury bonds are surging, the Dollar remains strong and even gold is getting a bid. Strength in these three at the same time just ain't normal and creates a headwind for stocks.
**This chart analysis is for educational purposes only, and should not
be construed as a recommendation to buy, sell or sell-short said securities**
Short-term Overview (Tuesday, 6-January-2015):
- The AD Lines peaked on 29-Dec and pulled back the last four days.
- The risk indicators are net negative (2 positive and 3 negative).
- SPY retraced 62% of its prior surge and is at a moment-of-truth.
- QQQ shows relative weakness and broke support.
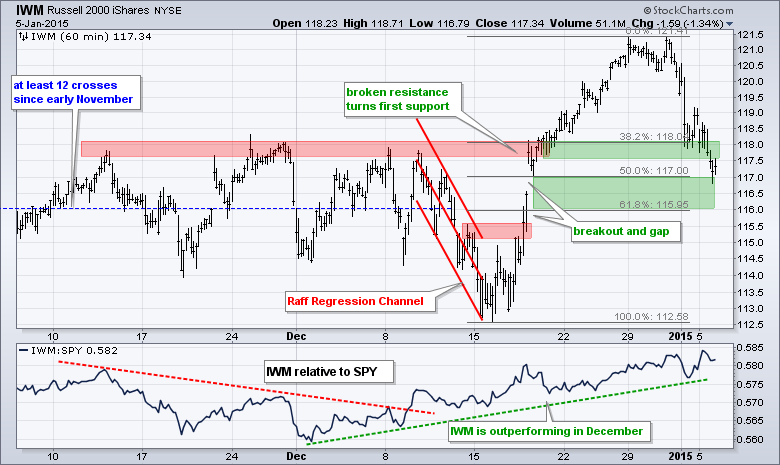
- IWM shows relative strength and retraced 50% of its prior surge.
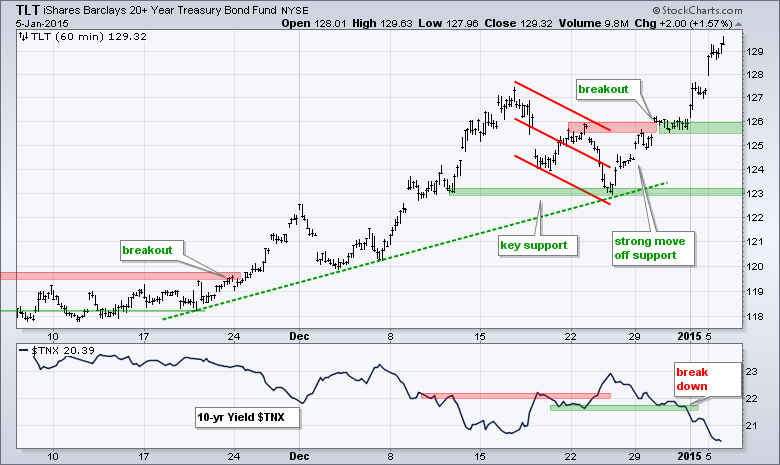
- TLT broke out in late December and hit another new high.
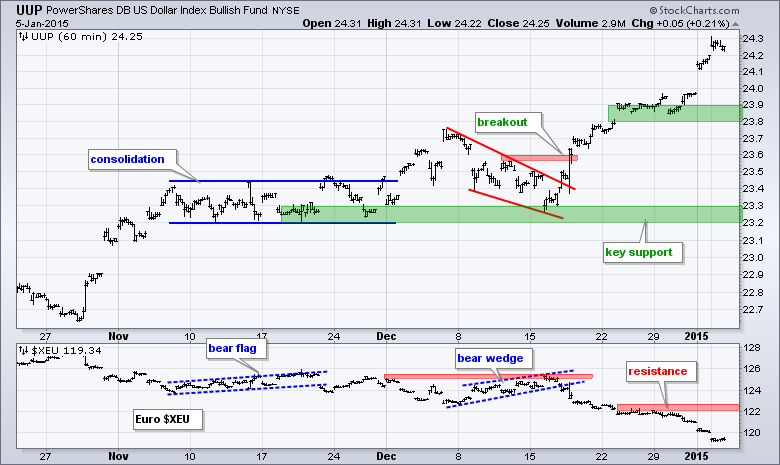
- UUP surged to new highs as the Euro plunged to new lows.
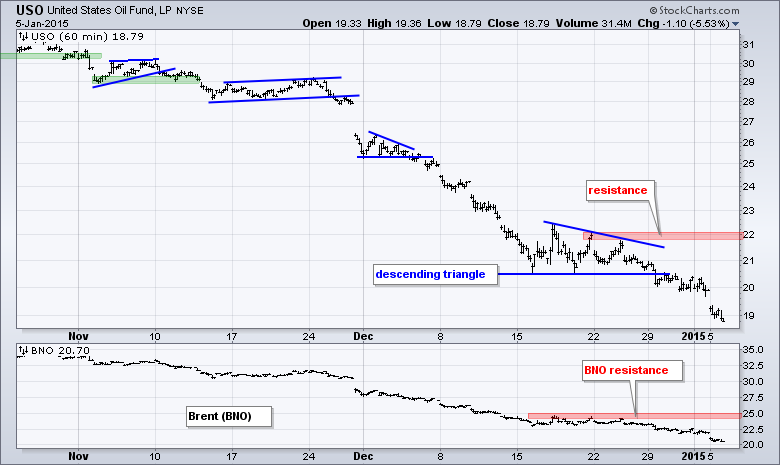
- USO broke descending triangle support to signal a continuation lower.
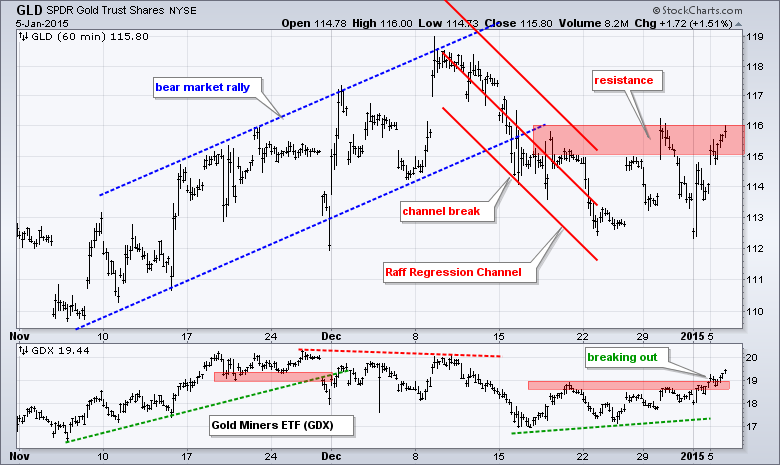
- GLD turned volatile over the last few weeks, but the channel break remains the dominant chart feature.
The March E-mini S&P 500 (^ESH15) fell to the bottom of its support zone and is short-term oversold after a four-day decline (3.3%). RSI(5) is below 30 and StochRSI(10) is below .20, which also suggest a short-term oversold condition. With the E-mini at the 62% retracement and broken resistance, this is an intriguing spot for at least an oversold bounce.
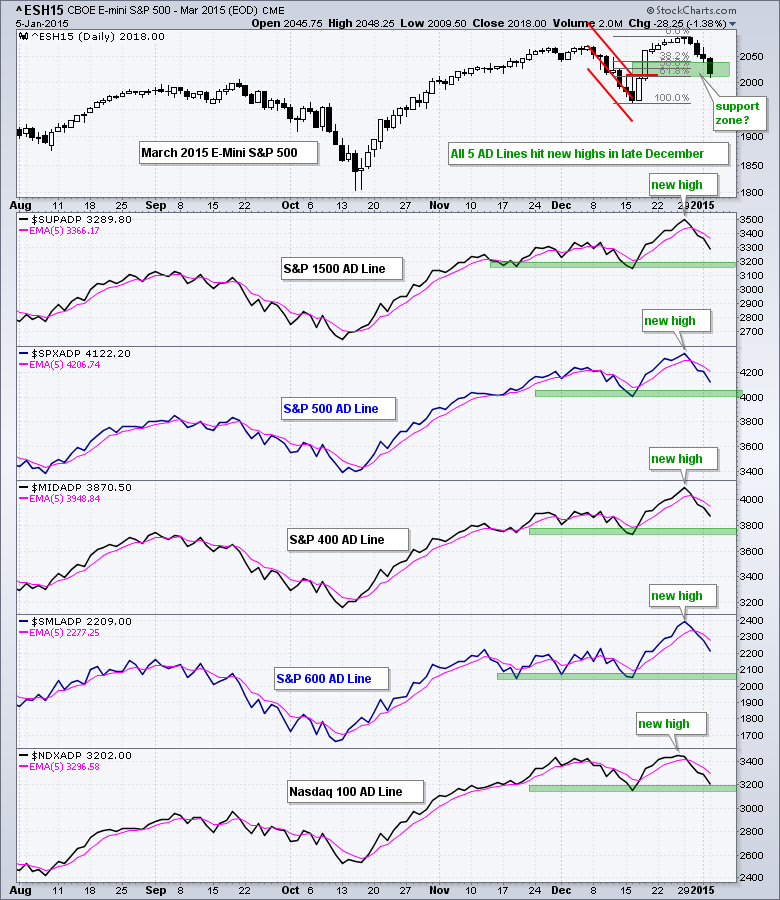
The five AD Lines hit new high at the end of December and then pulled back the last four days. The Nasdaq 100 AD Line is the weakest because it is already back near its mid December low. I changed the moving averages from 10-period EMAs to 5-period EMAs to identify the turns a little sooner.
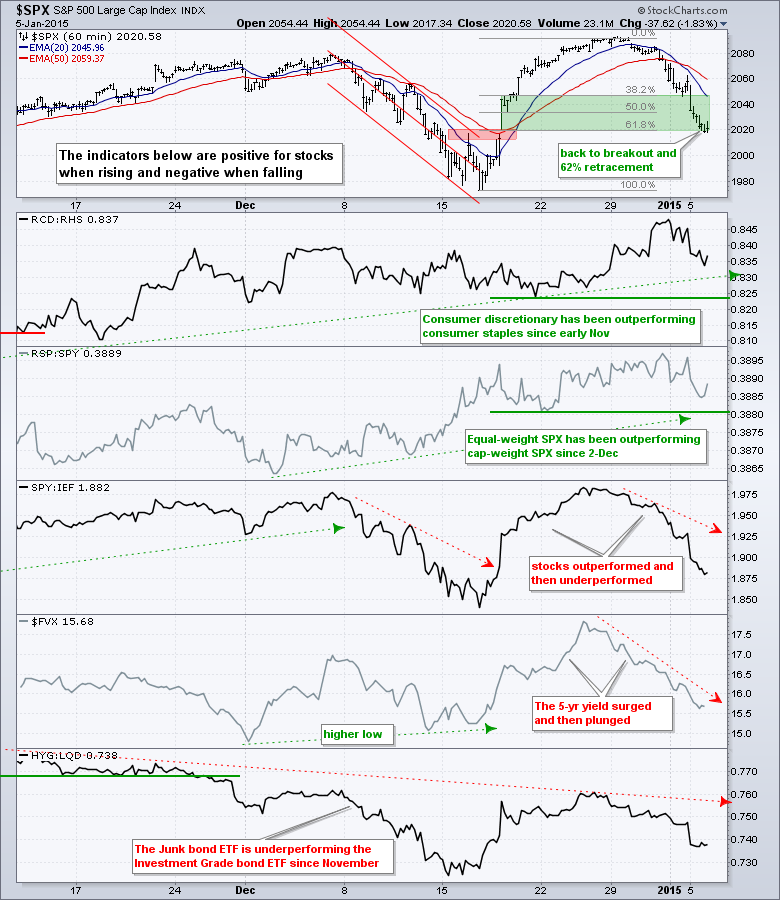
The risk indicators have tilted toward the bears. The two stock-related indicators remain positive, but the three bond-related indicators are negative. Treasuries surged over the last two weeks and outperformed stocks. Short-term Treasuries also surged as the 5-year Treasury Yield ($FVX) fell back below 1.6% (16). This indicates that money is moving into safe haven Treasuries. Also note that the HYG:LQD ratio fell the last two weeks as junk bonds weakened relative to investment grade bonds.
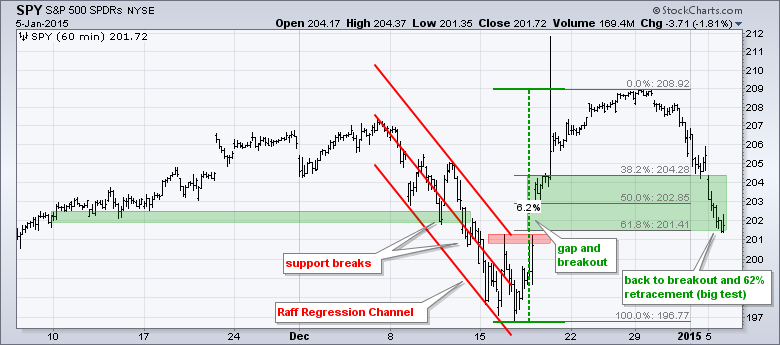
SPY surged around 6% and then fell 3.5%. The ETF opened weak with a gap and remained weak throughout the session. As with the E-mini and the S&P 500, SPY is at a moment-of-truth because it returned to the breakout and retraced 62% of the prior surge. SPY is also short-term oversold. This sets up for an important test of turnaround Tuesday.
**************************************************************
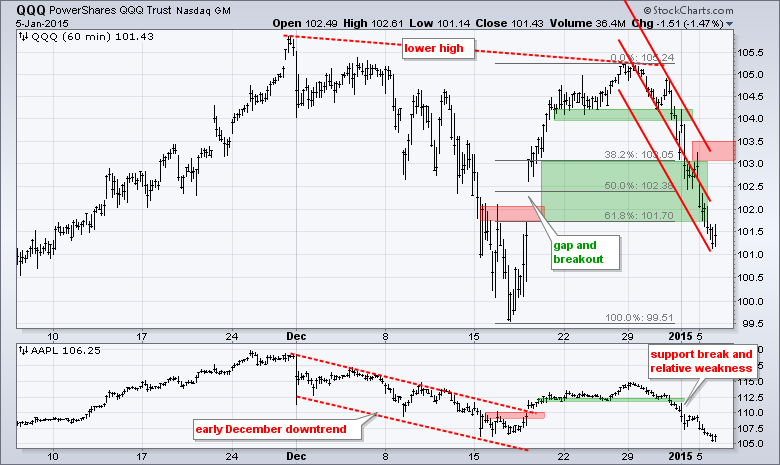
QQQ is the weakest of the three because it formed a lower high in late December and exceeded its 62% retracement. The Raff Regression Channel and 2-Jan high mark downswing resistance in the 103-103.5 area. Apple broke down in late December and moved below its mid December low on Monday.
**************************************************************
IWM is holding up the best of the three because it is in the middle of its retracement zone (50%) and the price relative is rising (IWM:SPY ratio). The move back below the breakout is negative and now we will see if the gap will offer support in the 117 area.
**************************************************************
No change. The 20+ YR T-Bond ETF (TLT) surged off support in the 123 area and broke resistance to end the short correction. With another new high, TLT has affirmed the uptrend and I will mark first support in the 125.5 area. The late December low marks key support in the 123 area. The indicator window shows the 10-YR Treasury Yield ($TNX) breaking down.
**************************************************************
No change. The US Dollar ETF (UUP) surged to new highs at yearend and again on Friday. This move was facilitated by a sharp decline in the Euro Index ($XEU). This trade is very lopsided with lots of Dollar bulls, but it is still working and price action remains bullish for the greenback. The late December lows mark first support in the 23.8 area and I will leave key support in the 23.2-23.3 area for now.
**************************************************************
No change. The USO Oil Fund (USO) tried to firm, but the bounces were weak and a descending triangle formed. The ETF broke support with a decline to the 20 area and this signals yet another continuation lower. The late December highs mark first resistance in the 22 area.
**************************************************************
No change. The Gold SPDR (GLD) broke down in mid December and then turned quite volatile the last few weeks. Notice how GLD bounced above/below the 114.5 level at least ten times since 16-Dec. The long-term trend is down and I still view the channel break as bearish. A close above 116 is needed to negate this channel break and call for a reassessment.
***************************************************************
Key Reports and Events (all times Eastern):
Tue - Jan 06 - 10:00 - Factory Orders
Tue - Jan 06 - 10:00 - ISM Services
Wed - Jan 07 - 07:00 - MBA Mortgage Index
Wed - Jan 07 - 08:15 - ADP Employment Change
Wed - Jan 07 - 08:30 - Trade Balance
Wed - Jan 07 - 10:30 - Oil Inventories
Wed - Jan 07 - 14:00 - FOMC Minutes
Thu - Jan 08 - 07:30 - Challenger Job
Thu - Jan 08 - 08:30 - Initial Jobless Claims
Thu - Jan 08 - 10:30 - Natural Gas Inventories
Thu - Jan 08 - 14:00 - Consumer Credit
Fri - Jan 09 - 08:30 - Nonfarm Payrolls
Fri - Jan 09 - 10:00 - Wholesale Inventories
This commentary is designed to stimulate thinking. This analysis is not a recommendation to buy, sell, hold or sell short any security (stock ETF or otherwise). We all need to think for ourselves when it comes to trading our own accounts. First, it is the only way to really learn. Second, we are the only ones responsible for our decisions. Think of these charts as food for further analysis. Before making a trade, it is important to have a plan. Plan the trade and trade the plan. Among other things, this includes setting a trigger level, a target area and a stop-loss level. It is also important to plan for three possible price movements: advance, decline or sideways. Have a plan for all three scenarios BEFORE making the trade. Consider possible holding times. And finally, look at overall market conditions and sector/industry performance.


