Stocks took it on the chin again with small-caps leading the way lower. IWM fell 1.73%, QQQ lost 1.34% and SPY declined .94%. All three are down over 4% the last five days and short-term oversold. It was clearly a risk off day as the 20+ YR T-Bond ETF (TLT) surged to new highs and the defensive sectors held up the best. The Utilities SPDR (XLU) closed with a fractional gain and provided one of the few bright spots. REITs were also strong as the REIT iShares (IYR) gained .73%. Looks like investors are looking for yield and not in MLPs. Energy stocks were hammered again as oil fell another 3.88%. Precious metals provided bright spot as gold broke out and silver surged over 5%. The Silver Miners ETF (SIL) may be putting in a double bottom and looks poised to challenge resistance from the November high.
**This chart analysis is for educational purposes only, and should not
be construed as a recommendation to buy, sell or sell-short said securities**
Short-term Overview (Wednesday, 7-January-2015):
- The breadth indicators are extremely oversold for the short-term.
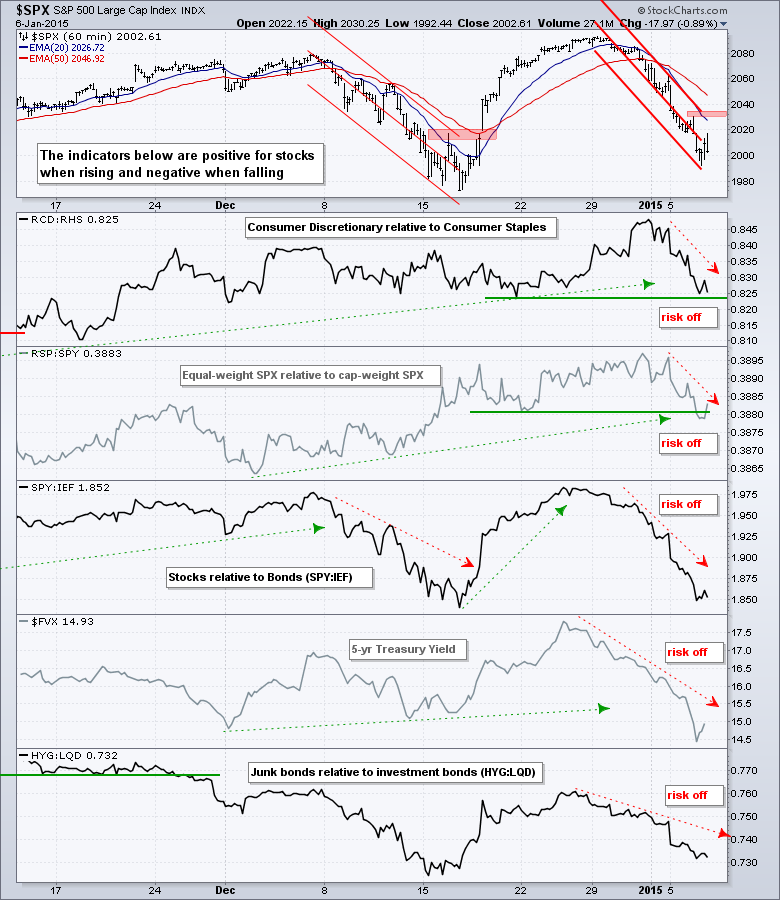
- The five risk indicators are negative.
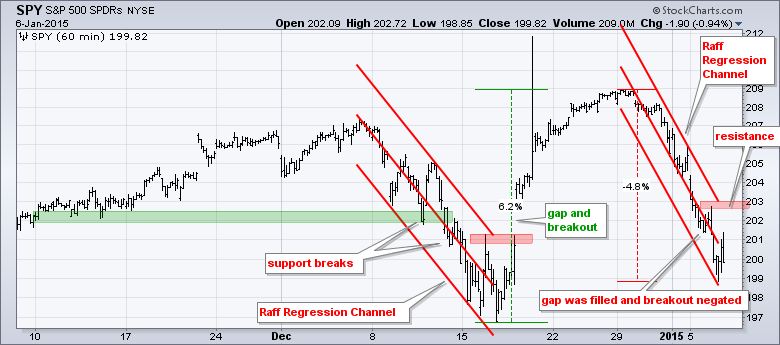
- SPY is in a short-term downtrend with resistance at 203.
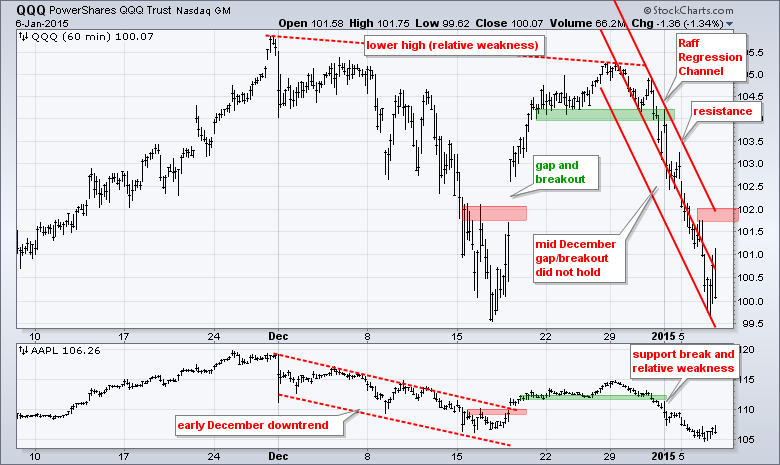
- QQQ shows relative weakness and is in a short-term downtrend with resistance at 102.
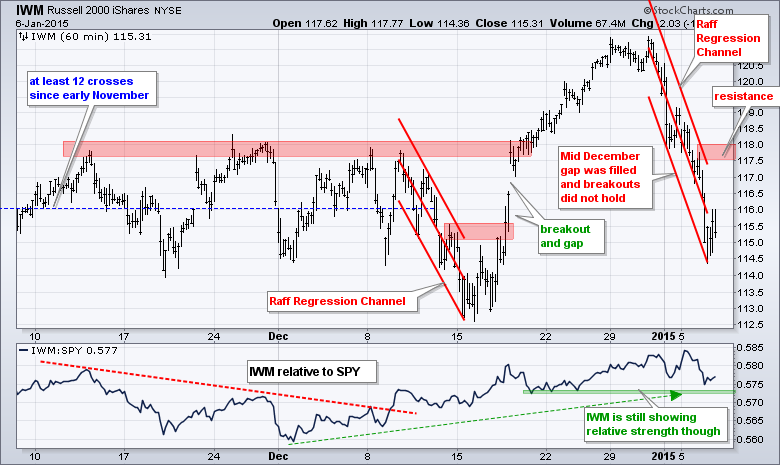
- IWM shows relative strength, but is in a short-term downtrend with resistance at 118.
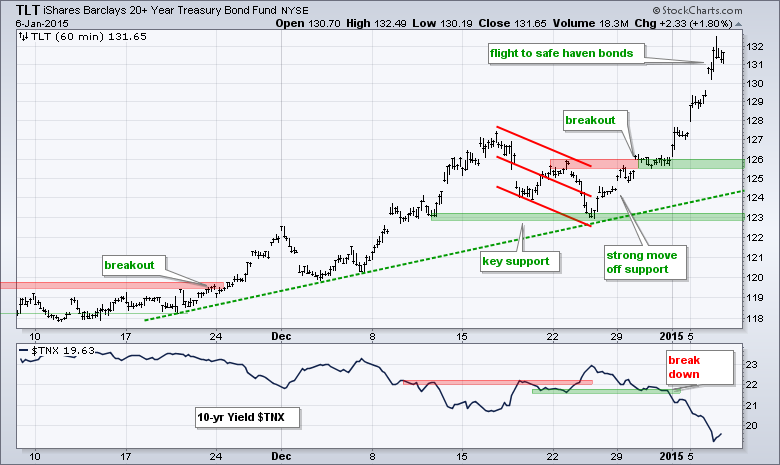
- TLT continued its uptrend as bonds attracted safe haven money.
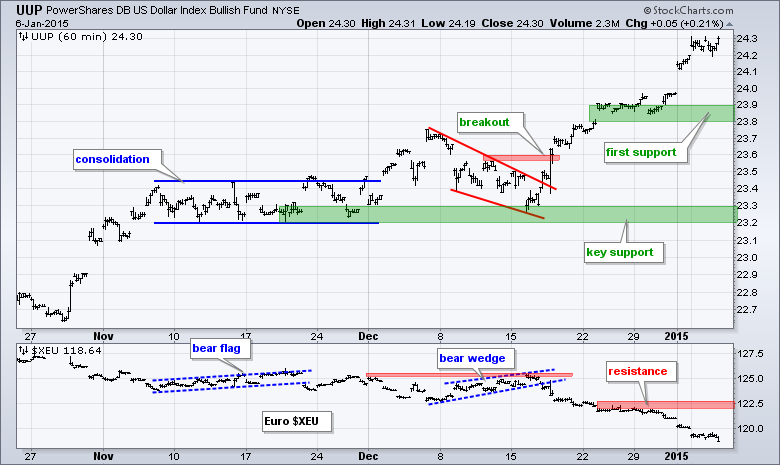
- UUP continued its uptrend as the Euro extended its slide.
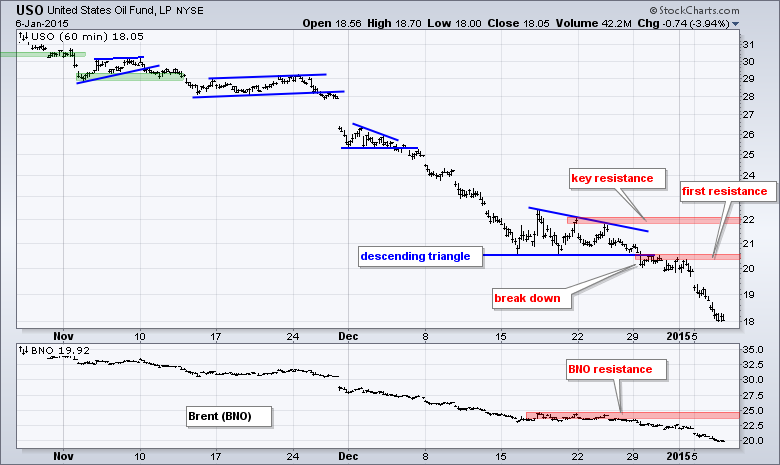
- USO broke descending triangle support in late December and continued its downtrend.
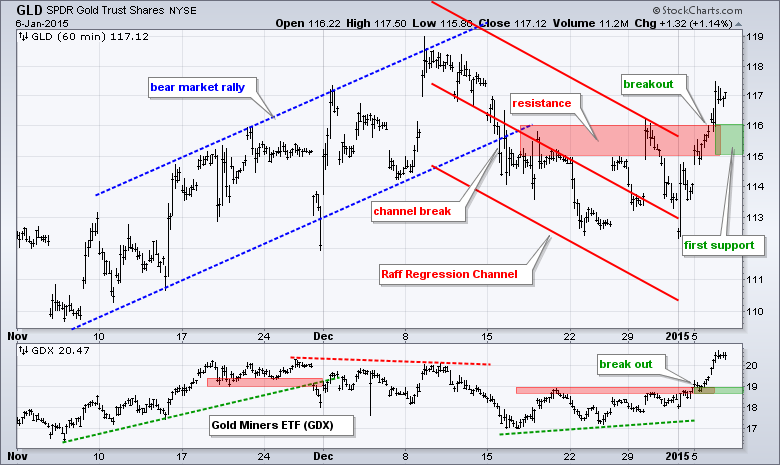
- GLD reversed its downtrend with a breakout on 6-Jan.
Today I am showing a chart with the 5-day SMA of AD Percent to show just how wild the breadth fluctuations have become. The main window shows the 5-day SMA of AD Percent for the S&P 1500 ($SUPADP). From March to June, a dip below -20 was considered oversold. This threshold moved to -30 in July and the indicator even dipped below -40 in late September. Most recently, the 5-day SMA surged above +50 in late December and then plunged below -50 yesterday. These are the two most extreme readings in over a year and show just how big the current swings were. Yes, Mr. Market never ceases to surprise. At this point, almost every short-term indicator is oversold and the stock market is primed for a bounce.
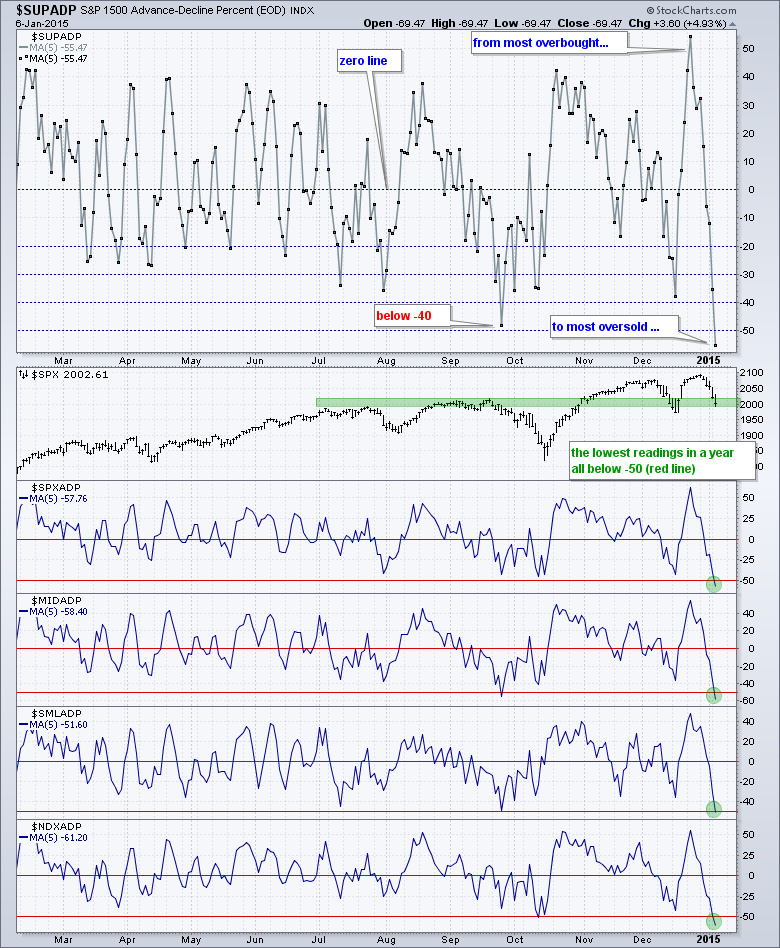
Some traders like to buy when oversold, but I prefer to wait for some sort of upside catalyst. As we have seen time and time again, the market can become oversold and remain oversold (oil). For example, the S&P 500 stalled when the indicator moved below -40 in September, but this did not mark the bottom because the S&P 500 continued lower in October. The most natural upside catalyst would be a surge back above the zero line. The problem now, however, is that the S&P 500 would probably have to move above 2050 to trigger such a signal and this would skew the reward-to-risk ratio. There seem to be two choices at this stage: pick a bottom with a stop below Monday's low or wait for another setup.
On the price chart, the S&P 500 is near support in the 2000 area and just above the mid December low. The big trend is also up because the index hit a new high just two weeks ago.
The risk indicators are all negative for stocks. Even though the consumer discretionary sector has been outperforming the consumer staples sector since early December, it has been lagging badly in 2015 and this is negative for the stock market. Similarly, the equal-weight S&P 500 has been lagging the cap-weight S&P 500 in 2015. All five risk indicators are pointing down in 2015.
The next segment shows the key charts with detailed annotations describing the developments.
**************************************************************
**************************************************************
**************************************************************
**************************************************************
**************************************************************
**************************************************************
***************************************************************
Key Reports and Events (all times Eastern):
Wed - Jan 07 - 07:00 - MBA Mortgage Index
Wed - Jan 07 - 08:15 - ADP Employment Change
Wed - Jan 07 - 08:30 - Trade Balance
Wed - Jan 07 - 10:30 - Oil Inventories
Wed - Jan 07 - 14:00 - FOMC Minutes
Thu - Jan 08 - 07:30 - Challenger Job
Thu - Jan 08 - 08:30 - Initial Jobless Claims
Thu - Jan 08 - 10:30 - Natural Gas Inventories
Thu - Jan 08 - 14:00 - Consumer Credit
Fri - Jan 09 - 08:30 - Nonfarm Payrolls
Fri - Jan 09 - 10:00 - Wholesale Inventories
This commentary is designed to stimulate thinking. This analysis is not a recommendation to buy, sell, hold or sell short any security (stock ETF or otherwise). We all need to think for ourselves when it comes to trading our own accounts. First, it is the only way to really learn. Second, we are the only ones responsible for our decisions. Think of these charts as food for further analysis. Before making a trade, it is important to have a plan. Plan the trade and trade the plan. Among other things, this includes setting a trigger level, a target area and a stop-loss level. It is also important to plan for three possible price movements: advance, decline or sideways. Have a plan for all three scenarios BEFORE making the trade. Consider possible holding times. And finally, look at overall market conditions and sector/industry performance.


