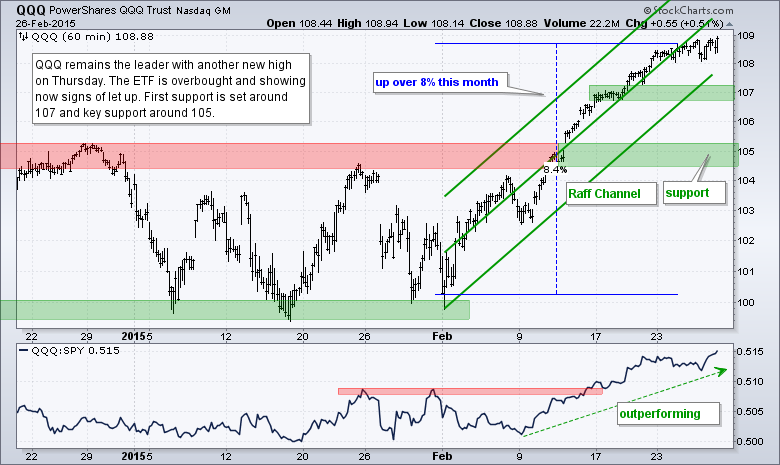
It was a mixed day on Wall Street. Large-cap techs and small-caps led with modest gains. Mid-caps and the equal-weight S&P 500 lagged with modest losses. Energy got slammed again as oil fell. Small-cap performance was impressive because eight of the nine small-caps sector ETFs gained ground. The Internet ETF (FDN) was also strong as Google surged over 5% and Facebook closed above 80 for the first time this year.
**This chart analysis is for educational purposes only, and should not
be construed as a recommendation to buy, sell or sell-short said securities**
Short-term Overview (Friday, 27-February-2015):
- Breadth has been quite flat the last two weeks, but the 10-day Average still supports a short-term uptrend.
- The risk indicators are net positive for stocks.
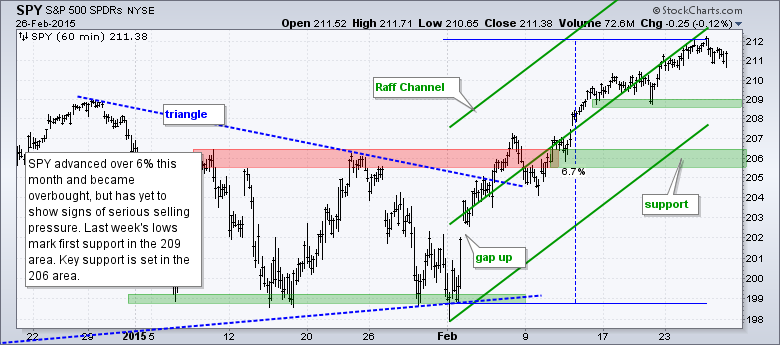
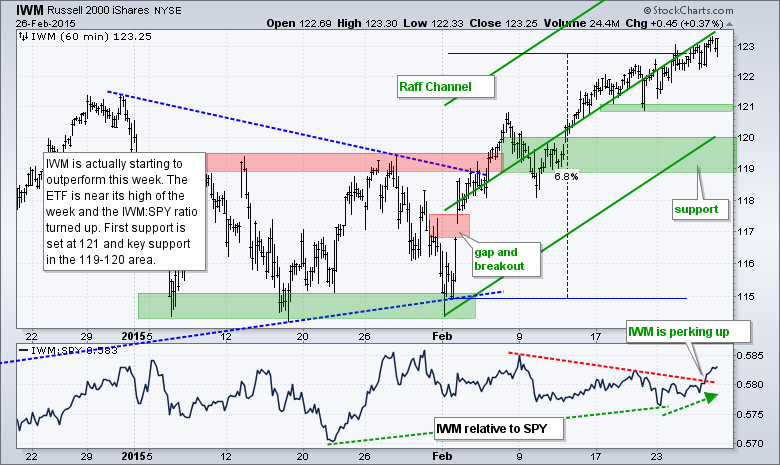
- SPY, QQQ and IWM are in short-term uptrends, but overbought after big moves this month.
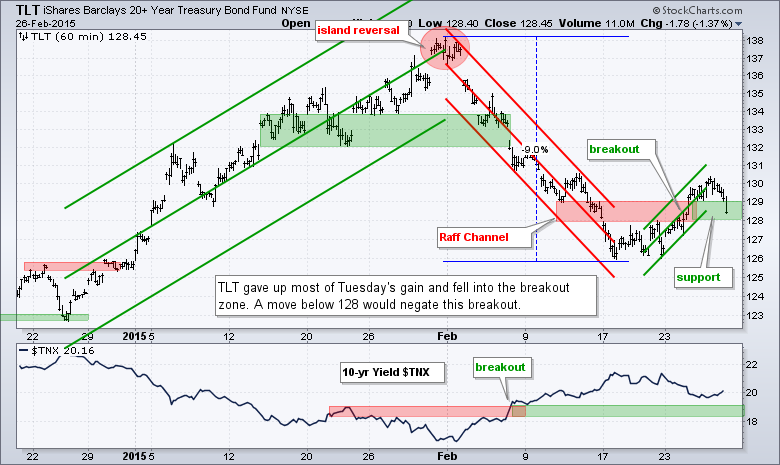
- TLT broke out, but gave back a good portion of its surge and is in jeopardy of negating the breakout.
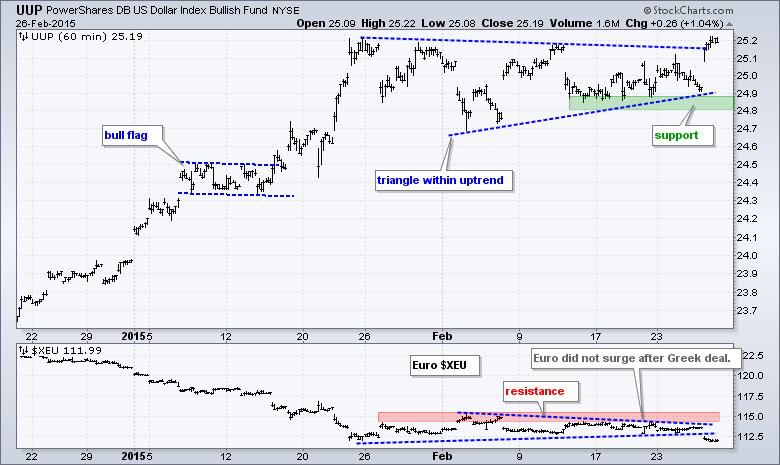
- UUP surged off the lower trend line of a triangle and broke above the upper trend line.
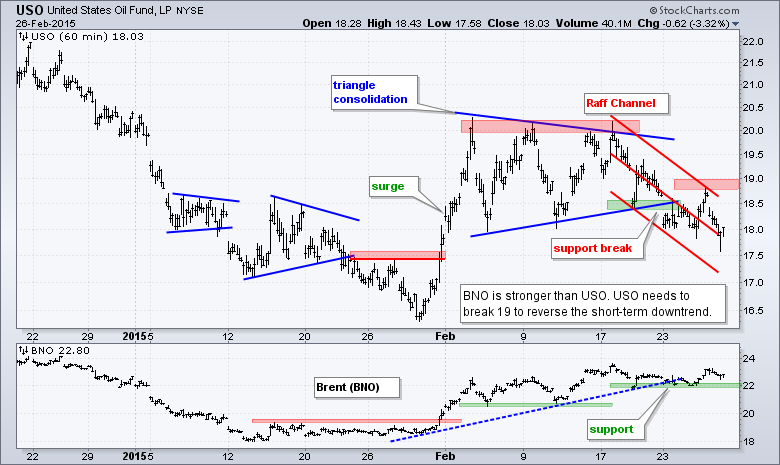
- USO fell back within the short-term downtrend and needs to clear 19 for a breakout.
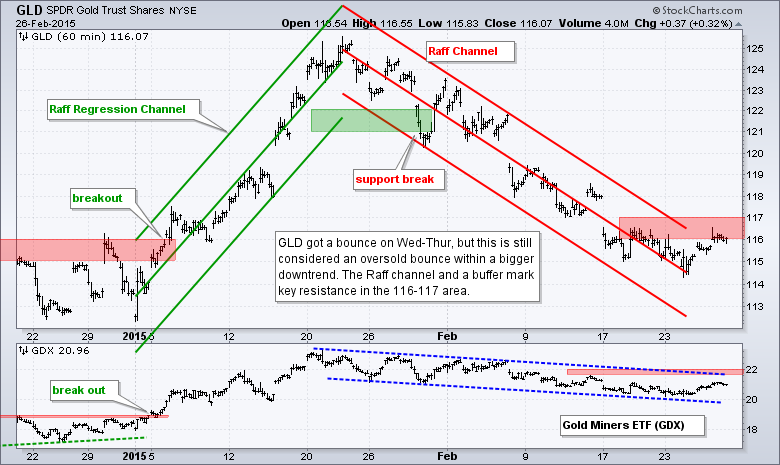
- GLD bounced on Wednesday-Thursday, but remains within a well-defined downtrend (since 29-Jan).
The incremental gains and losses continue for the E-mini, but the gains are still outpacing the losses, and this keeps the uptrend alive. Overall, the triangle breakout remains and the broken resistance zone turns into the first support zone on the daily bar chart.
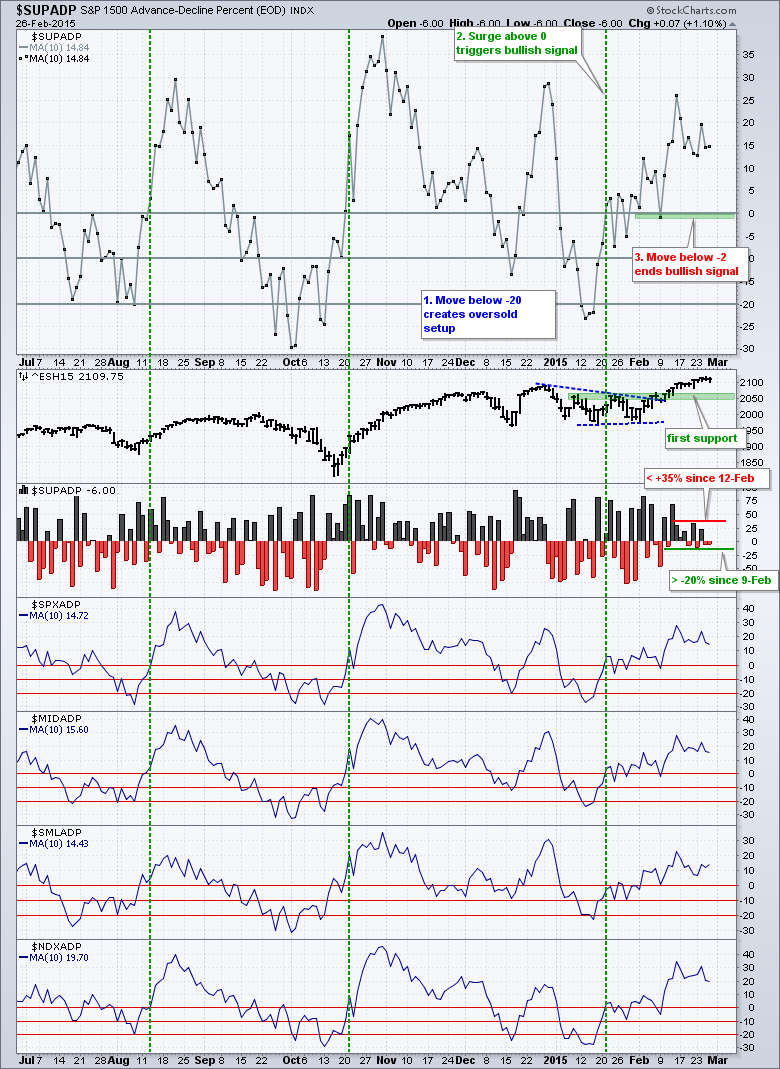
Breadth remains short-term bullish overall, but the daily readings show indecision over the last nine days. S&P 1500 AD Percent ($SUPADP) was down four of the last nine days and has not been higher than +35% since February 12th. The bearish days, however, are even weaker because AD Percent has not been below -20% since February 9th. The 10-day SMA of AD Percent, which averages it all out for a bias, remains positive and this supports a short-term uptrend in the major index ETFs.
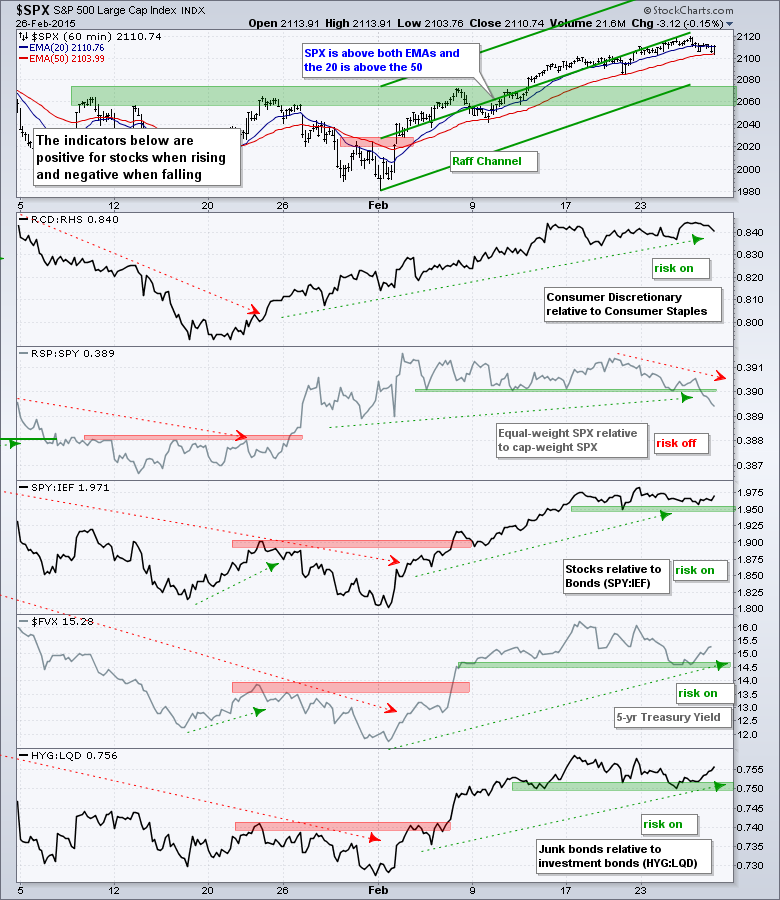
The risk indicators remain net positive for stocks, but we are seeing relative weakness in the equal-weight S&P 500. The RSP:SPY ratio turned down over the past week and broke below its mid February lows. This means the average stock in the S&P 500 is underperforming the large-caps in the index. This is, however, the only indicator that is negative. The 5-year Treasury Yield ($FVX) surged on Thursday and bond prices moved lower. I am going to upgrade this indicator back to positive.
No change. The short-term evidence remains bullish for stocks, but the picture is less bullish than last week. Breadth is uninspiring because S&P 1500 AD Percent ($SUPADP) has not been above +35% since 12-February and signs of risk aversion are starting to creep into the bond market. SPY, IWM and QQQ are in uptrends, but short-term overbought and ripe for a pullback or consolidation.
**************************************************************
**************************************************************
**************************************************************
**************************************************************
**************************************************************
**************************************************************
***************************************************************
Key Reports and Events (all times Eastern):
Fri - Feb 27 - 08:30 - GDP
Fri - Feb 27 - 09:45 - Chicago PMI
Fri - Feb 27 - 09:55 - Michigan Sentiment
Fri - Feb 27 - 10:00 - Pending Home Sales
This commentary is designed to stimulate thinking. This analysis is not a recommendation to buy, sell, hold or sell short any security (stock ETF or otherwise). We all need to think for ourselves when it comes to trading our own accounts. First, it is the only way to really learn. Second, we are the only ones responsible for our decisions. Think of these charts as food for further analysis. Before making a trade, it is important to have a plan. Plan the trade and trade the plan. Among other things, this includes setting a trigger level, a target area and a stop-loss level. It is also important to plan for three possible price movements: advance, decline or sideways. Have a plan for all three scenarios BEFORE making the trade. Consider possible holding times. And finally, look at overall market conditions and sector/industry performance.


