The S&P 500 moved to a new high during the session, but selling pressure hit in the afternoon and the index closed with a fractional loss. Wednesday's price action is the first negative price action we have seen in a while. The inability to hold a new high and the afternoon selling pressure point to a bull run that may be tiring. This is not bearish, but it does suggest that the going could get tougher for the bulls. The consumer discretionary and energy sectors led on Wednesday, while utilities and consumer staples lagged. The Utilities SPDR (XLU) was hit for a 1.64% loss, but remains in a support zone from the November-December consolidation. Defensive sectors like utilities and consumer staples may be less appealing because cyclical groups like housing and semiconductors are leading.
**This chart analysis is for educational purposes only, and should not
be construed as a recommendation to buy, sell or sell-short said securities**
Short-term Overview (Thursday, 26-February-2015):
- Breadth has been quite flat the last nine days, but the 10-day Average still supports a short-term uptrend.
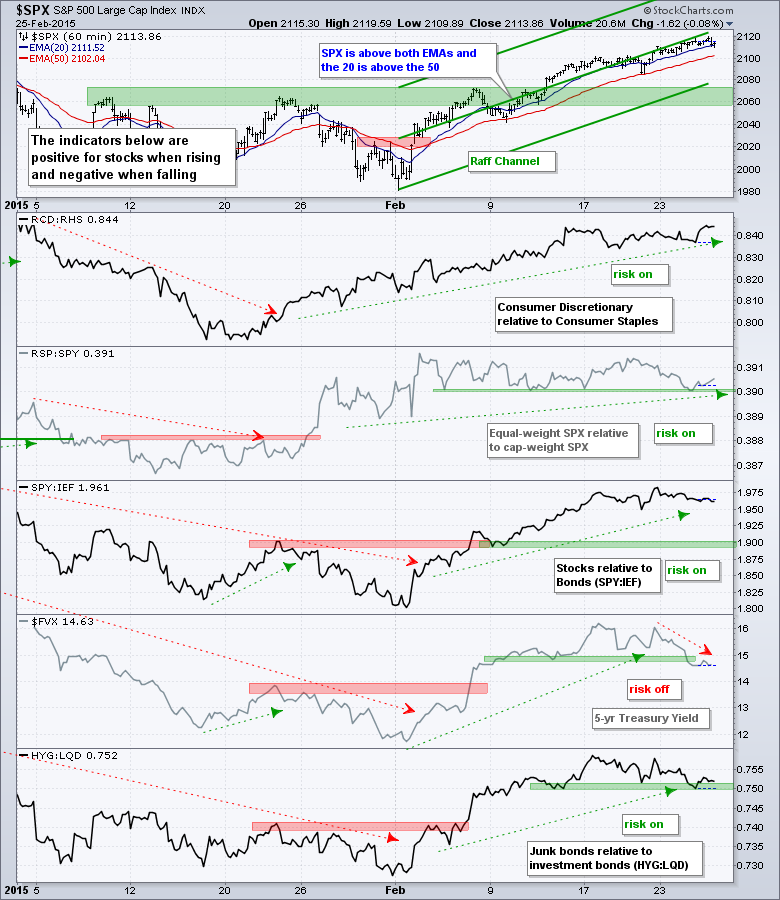
- The risk indicators are net positive, but some risk aversion is appearing in the bond market.
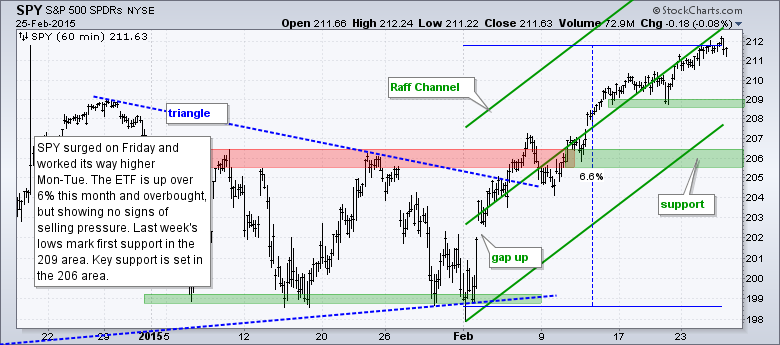
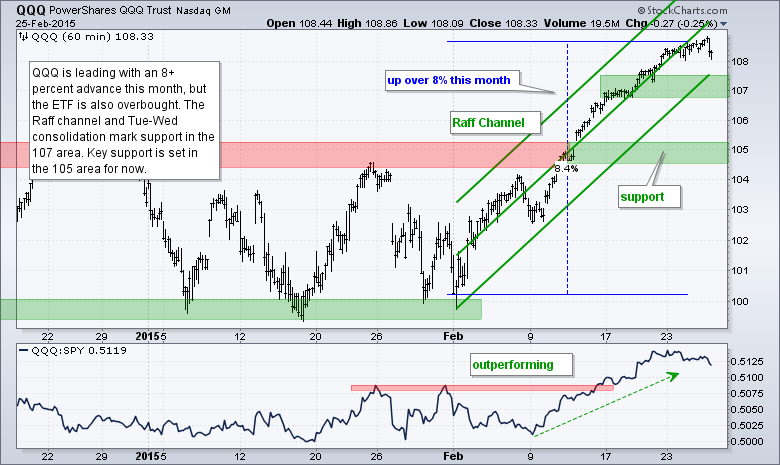
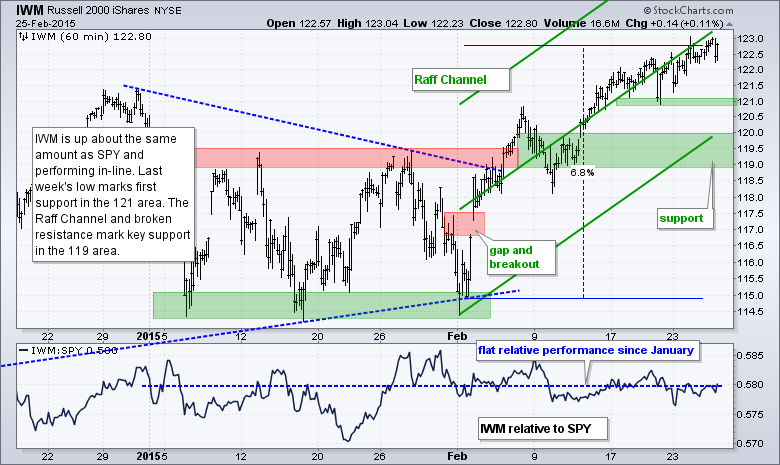
- SPY, QQQ and IWM are in short-term uptrends, but overbought after big moves this month.
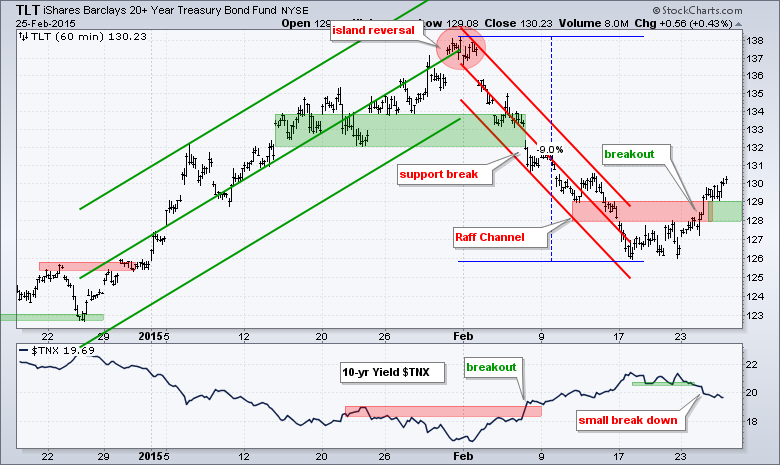
- TLT broke out with a surge on 24-Feb and the breakout zone marks first support.
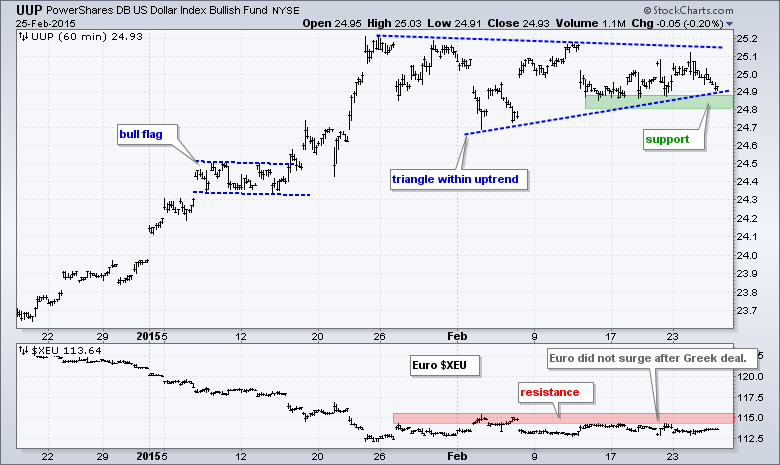
- UUP is firming near the lower trend line of a triangle and within an uptrend overall.
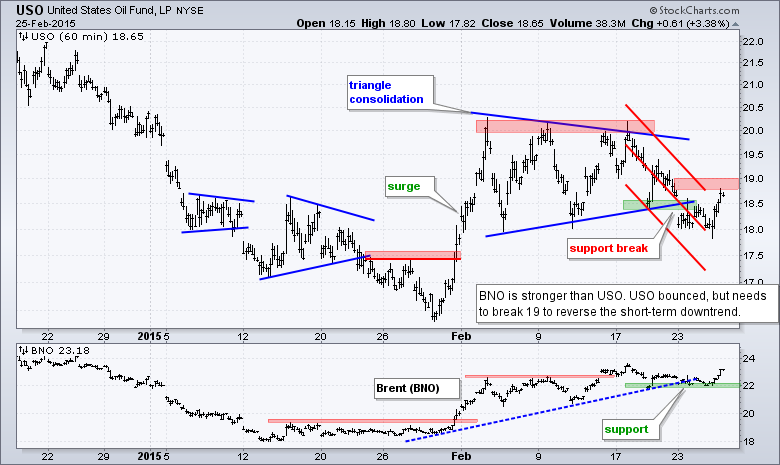
- USO surged some 3%, but needs follow through to break resistance from the Raff channel.
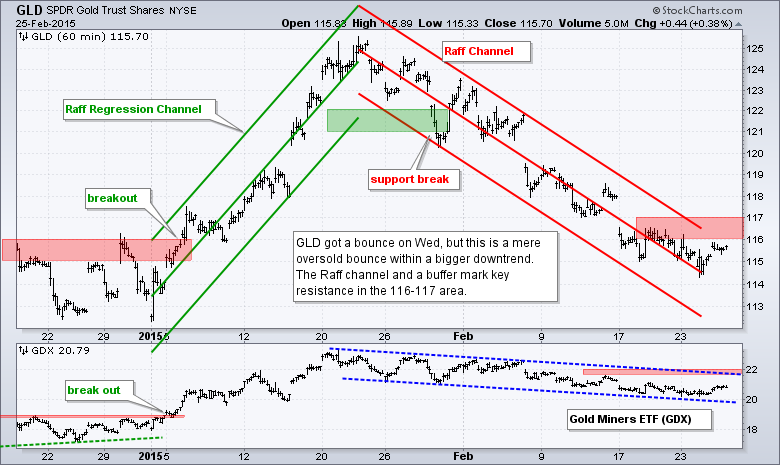
- GLD bounced on Wednesday, but remains within a well-defined downtrend (since 29-Jan).
The last nine sessions have been pretty uneventful, but the uptrend continues because the E-mini is up around 30 points since 16-February. That's around 3.33 points per session. Slow and steady is winning the race right now. Overall, the triangle breakout remains and the broken resistance zone turns into the first support zone on the daily bar chart.
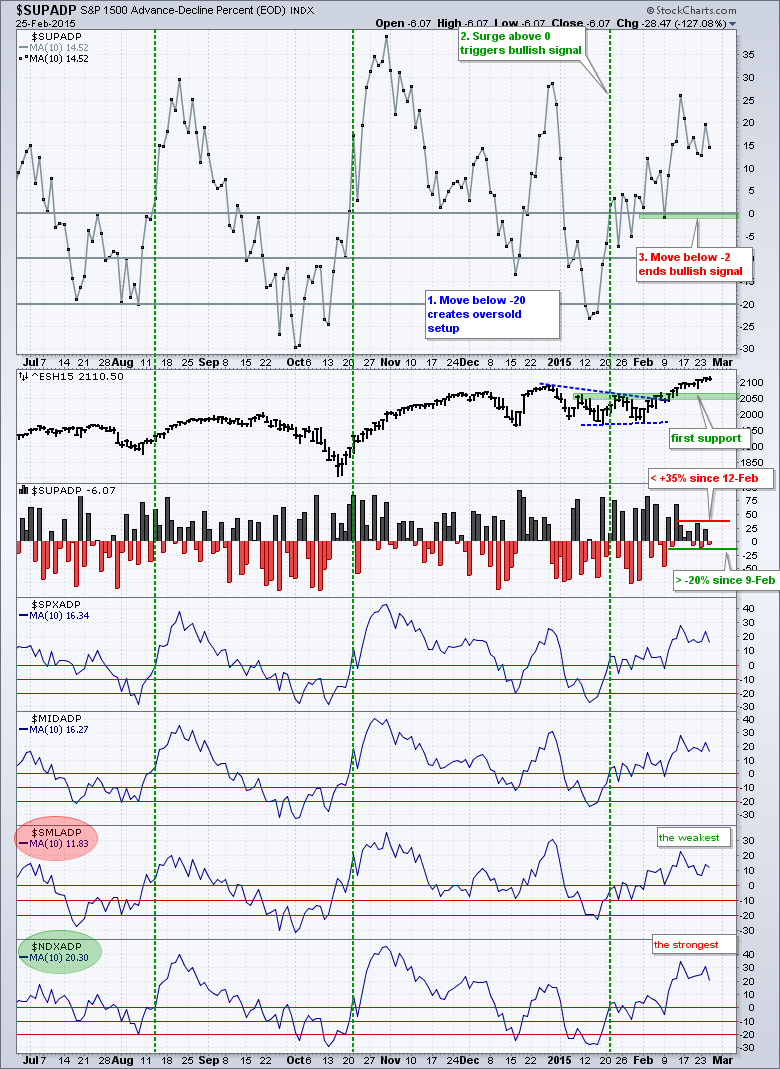
Breadth remains short-term bullish overall, but the daily readings show indecision over the last five days. S&P 1500 AD Percent ($SUPADP) was down three of the last five days and has not been higher than +35% since February 12th. In other words, we have not seen a strong breadth day since then. The bearish days, however, are even weaker because AD Percent has not been below -20% since February 9th. The 10-day SMA of AD Percent, which averages it all out for a bias, remains positive and this supports a short-term uptrend in the major index ETFs.
The risk indicators are still net positive for stocks. The consumer discretionary sector has been outperforming the consumer staples sector since 20-January. The equal-weight S&P 500 has been flat relative to the cap-weight S&P 500 this month, but has yet to break down and small-caps have yet to show serious relative weakness. Stocks are outperforming bonds (SPY:IEF), but the 5-year Treasury Yield ($FVX) broke support with a sharp downturn this week. This may be a pullback in $FVX, but I would like to see a move back above 1.5% (15 on the chart) to suggest that money is moving out of short-term Treasury bonds.
No change. The short-term evidence remains bullish for stocks, but the picture is less bullish than last week. Breadth is uninspiring because S&P 1500 AD Percent ($SUPADP) has not been above +35% since 12-February and signs of risk aversion are starting to creep into the bond market. SPY, IWM and QQQ are in uptrends, but short-term overbought and ripe for a pullback or consolidation.
**************************************************************
**************************************************************
**************************************************************
**************************************************************
**************************************************************
**************************************************************
***************************************************************
Key Reports and Events (all times Eastern):
Thu - Feb 26 - 08:30 - Initial Jobless Claims
Thu - Feb 26 - 08:30 - Consumer Price Index (CPI)
Thu - Feb 26 - 08:30 - Durable Goods Orders
Thu - Feb 26 - 09:00 - FHFA Housing Price Index
Thu - Feb 26 - 10:30 - Natural Gas Inventories
Fri - Feb 27 - 08:30 - GDP
Fri - Feb 27 - 09:45 - Chicago PMI
Fri - Feb 27 - 09:55 - Michigan Sentiment
Fri - Feb 27 - 10:00 - Pending Home Sales
This commentary is designed to stimulate thinking. This analysis is not a recommendation to buy, sell, hold or sell short any security (stock ETF or otherwise). We all need to think for ourselves when it comes to trading our own accounts. First, it is the only way to really learn. Second, we are the only ones responsible for our decisions. Think of these charts as food for further analysis. Before making a trade, it is important to have a plan. Plan the trade and trade the plan. Among other things, this includes setting a trigger level, a target area and a stop-loss level. It is also important to plan for three possible price movements: advance, decline or sideways. Have a plan for all three scenarios BEFORE making the trade. Consider possible holding times. And finally, look at overall market conditions and sector/industry performance.


