Stocks put in another good performance on Tuesday. The S&P 500 opened strong and worked its way higher the rest of the day. As with last week, this is the kind of price action the bulls want to see. The consumer discretionary, healthcare and technology sectors led the way. The Equal-Weight Consumer Discretionary ETF (RCD) was up over 2%, the Home Construction iShares (ITB) was up over 1% and the Retail SPDR (XRT) gained over 1%. Semiconductors stole the show in the technology sector with the Semiconductor SPDR (XSD) surging over 2%. This broad semiconductor ETF also hit a new high and shows relative strength. It is hard to argue with relative strength in consumer discretionary and semiconductors.
**This chart analysis is for educational purposes only, and should not
be construed as a recommendation to buy, sell or sell-short said securities**
Short-term Overview (Wednesday, 11-February-2015):
- Short-term breadth turned bullish on 21-Jan and remains bullish.
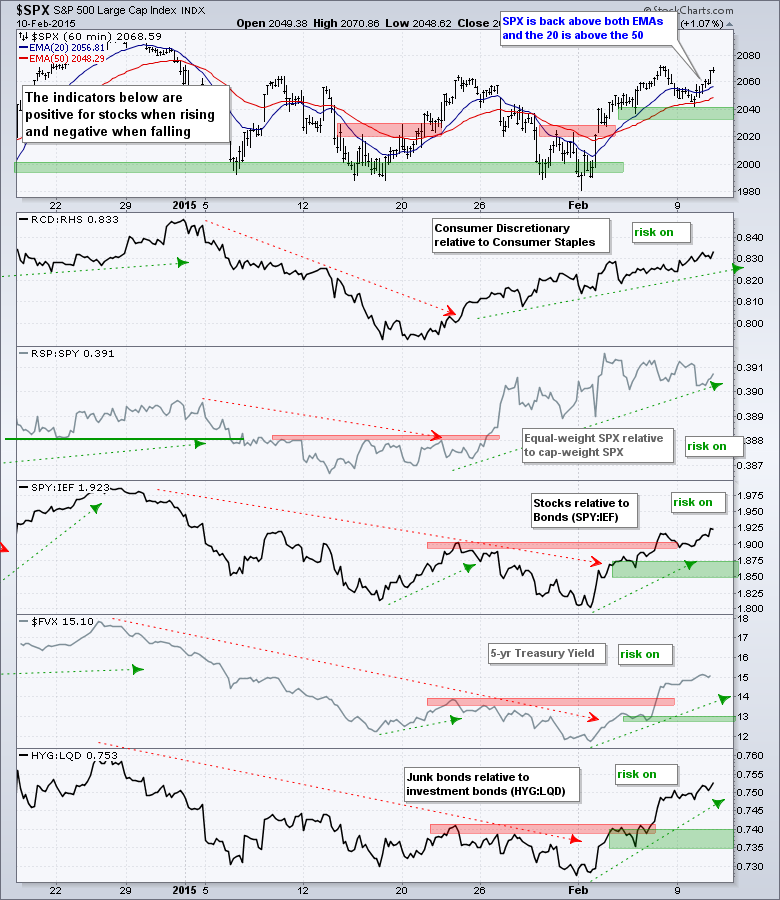
- All five risk indicators are positive.
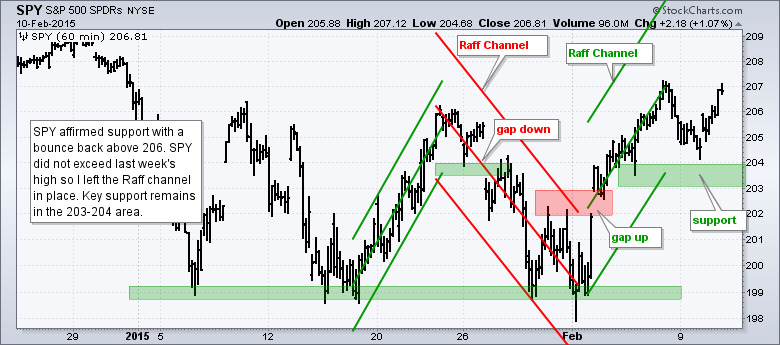
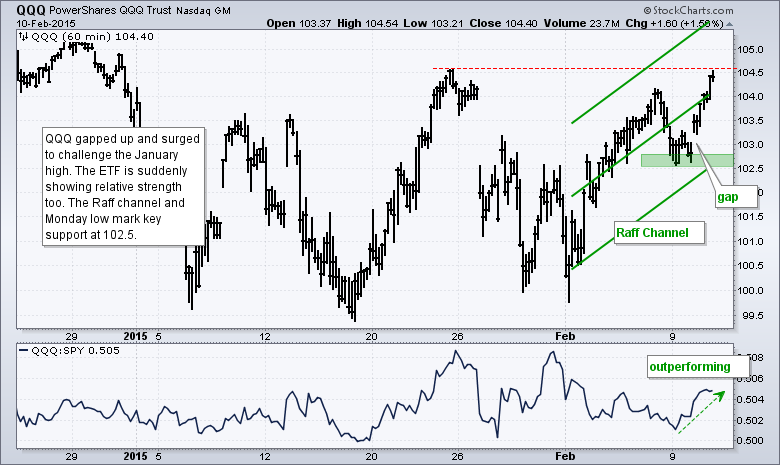
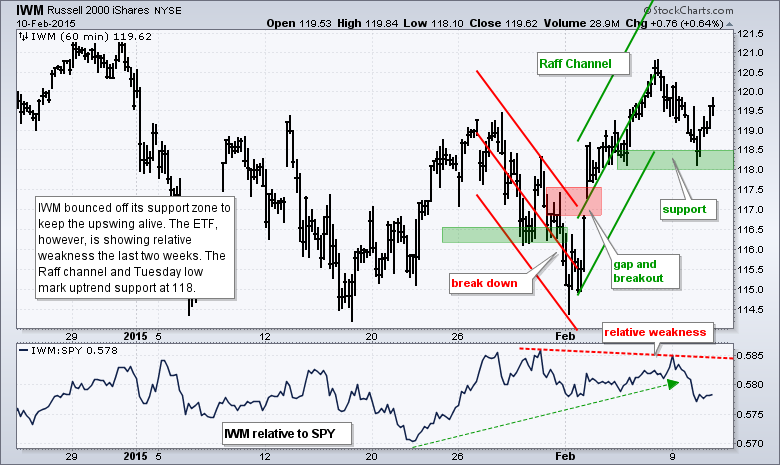
- SPY, QQQ and IWM bounced off support zones to keep their short-term uptrends alive.
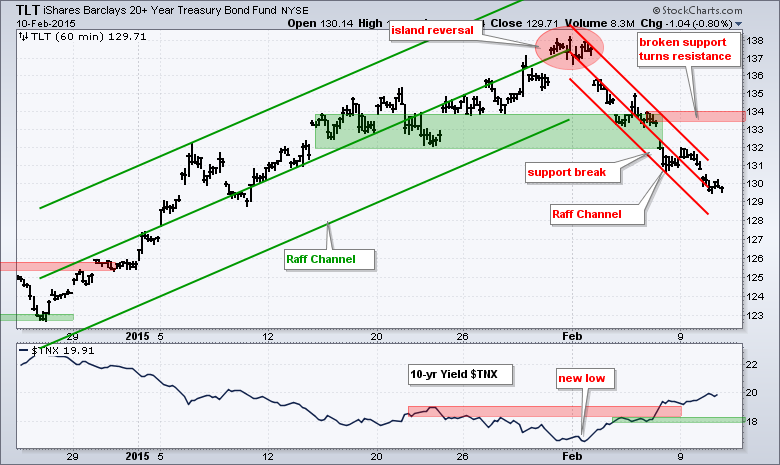
- TLT broke short-term support on Friday and the short-term trend is down.
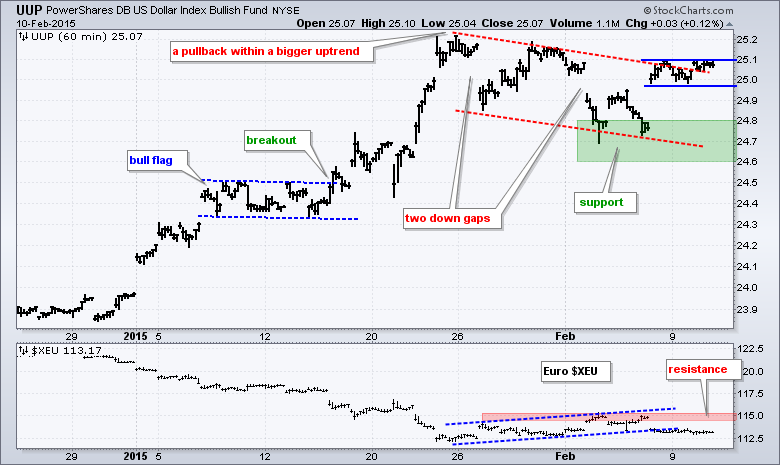
- UUP is consolidating near the upper trend line of a falling flag.
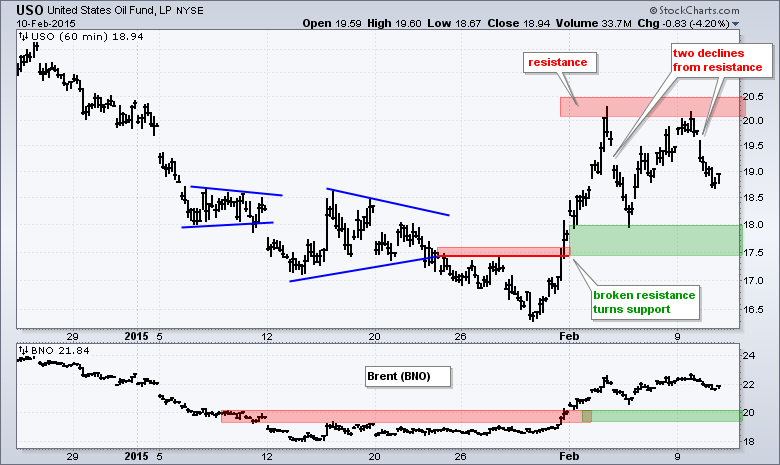
- USO is choppy and untradeable.
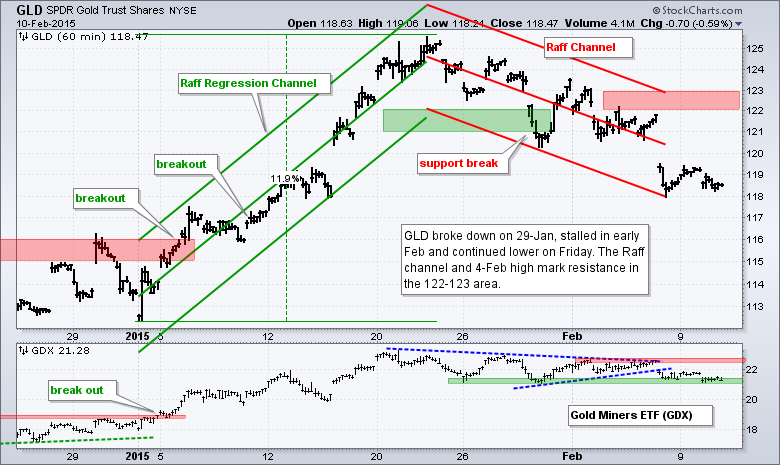
- GLD broke down on 29-Jan and remains in a short-term downtrend.
The E-mini found its legs again and moved above 2050. In fact, yesterday's close was the highest close of the year (2015). It looks like the E-mini is making an attempt to break out of the January consolidation.
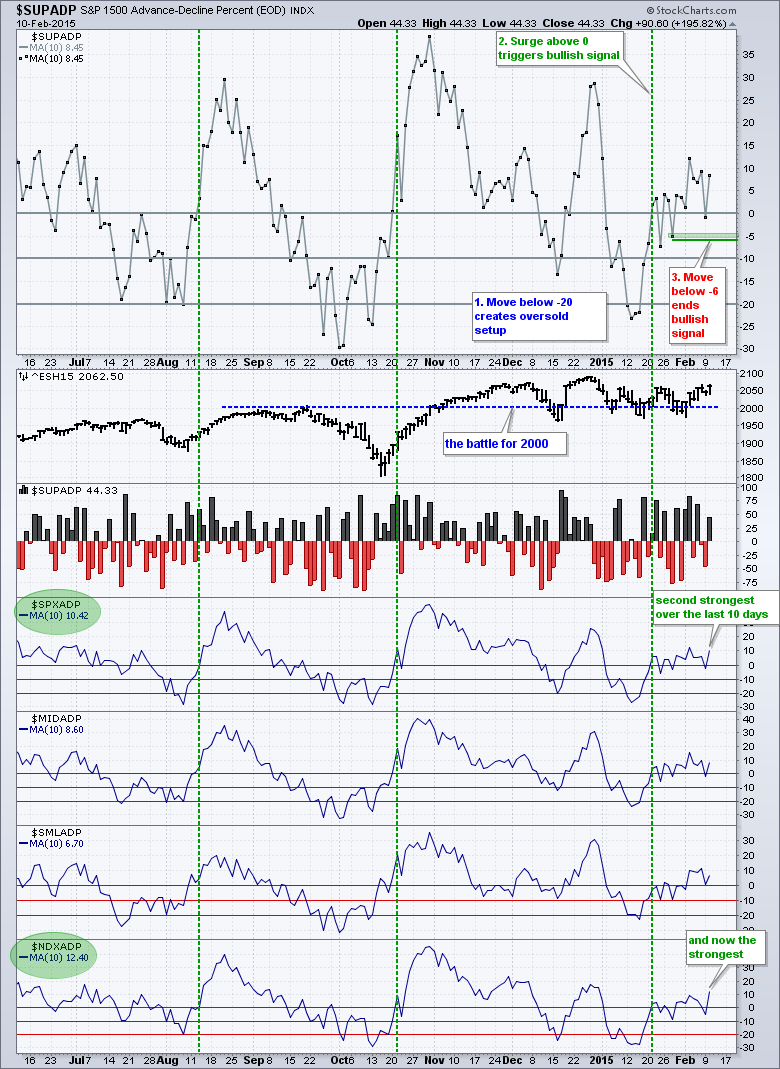
Broad market breadth remains bullish as the 10-day SMA for S&P 1500 AD Percent ($SUPADP) moved back into positive territory. -6% remains the line in the sand for this indicator and it will remain bullish until a move below this level. The S&P 500 and Nasdaq 100 led the breadth indicators. S&P 500 AD Percent ($SPXADP) hit +67% and Nasdaq 100 AD Percent ($NDXADP) surged to +85%. Yes, it was a big day for large-cap techs. In fact, the 10-day SMA for Nasdaq 100 AD Percent is the highest of the group now and QQQ is suddenly showing relative strength.
All five risk indicators remain positive for stocks. I continued to be impressed with relative strength in the Equal-Weight Consumer Discretionary ETF (RCD), relative to the Equal-weight Consumer Staples ETF (RHS) that is. Consumer discretionary has outperformed since the second half of January and this bodes well for consumer spending.
The short-term evidence remains bullish and large-cap techs are starting to lead again. Breadth is not that strong, but it is certainly not negative. All five risk indicators are positive for stocks. SPY, IWM and QQQ bounced off support on Tuesday and QQQ is already challenging its January high. These bounces affirm the short-term uptrends and key support levels.
**************************************************************
**************************************************************
**************************************************************
**************************************************************
**************************************************************
**************************************************************
***************************************************************
Key Reports and Events (all times Eastern):
Wed - Feb 11 - 07:00 - MBA Mortgage Index
Wed - Feb 11 - 10:30 - Oil Inventories
Thu - Feb 12 - 08:30 - Initial Jobless Claims
Thu - Feb 12 - 08:30 - Retail Sales
Thu - Feb 12 - 10:30 - Natural Gas Inventories
Fri - Feb 13 - 09:55 - Michigan Sentiment
Tue - Feb 17 - 08:30 - Empire Manufacturing
Tue - Feb 17 - 10:00 - NAHB Housing Market Index
Wed - Feb 18 - 07:00 - MBA Mortgage Index
Wed - Feb 18 - 08:30 - Housing Starts/Building Permits
Wed - Feb 18 - 08:30 - Producer Price Index (PPI)
Wed - Feb 18 - 09:15 - Industrial Production
Wed - Feb 18 - 14:00 - FOMC Minutes
Thu - Feb 19 - 08:30 - Initial Jobless Claims
Thu - Feb 19 - 10:00 - Philadelphia Fed
Thu - Feb 19 - 10:00 - Leading Indicators
Thu - Feb 19 - 10:30 - Natural Gas Inventories
Thu - Feb 19 - 11:00 - Oil Inventories
Mon - Feb 23 - 10:00 - Existing Home Sales
Tue - Feb 24 - 09:00 - Case-Shiller 20-city Index
Tue - Feb 24 - 10:00 - Consumer Confidence
Wed - Feb 25 - 07:00 - MBA Mortgage Index
Wed - Feb 25 - 10:00 - New Home Sales
Wed - Feb 25 - 10:30 - Oil Inventories
Thu - Feb 26 - 08:30 - Initial Jobless Claims
Thu - Feb 26 - 08:30 - Consumer Price Index (CPI)
Thu - Feb 26 - 08:30 - Durable Goods Orders
Thu - Feb 26 - 09:00 - FHFA Housing Price Index
Thu - Feb 26 - 10:30 - Natural Gas Inventories
Fri - Feb 27 - 08:30 - GDP
Fri - Feb 27 - 09:45 - Chicago PMI
Fri - Feb 27 - 09:55 - Michigan Sentiment
Fri - Feb 27 - 10:00 - Pending Home Sales
This commentary is designed to stimulate thinking. This analysis is not a recommendation to buy, sell, hold or sell short any security (stock ETF or otherwise). We all need to think for ourselves when it comes to trading our own accounts. First, it is the only way to really learn. Second, we are the only ones responsible for our decisions. Think of these charts as food for further analysis. Before making a trade, it is important to have a plan. Plan the trade and trade the plan. Among other things, this includes setting a trigger level, a target area and a stop-loss level. It is also important to plan for three possible price movements: advance, decline or sideways. Have a plan for all three scenarios BEFORE making the trade. Consider possible holding times. And finally, look at overall market conditions and sector/industry performance.


