Selling pressure extended on Monday, but the selling pressure was rather tame and the losses were modest. A little selling pressure after a big advance last week is normal at this stage. Healthcare, utilities and consumer staples led the sectors lower. Energy stocks gained as oil extended its bounce. The industry group ETFs were quite mixed. The Home Construction iShares (ITB) edged higher, but the Home Builders SPDR (XHB) closed slightly lower. The Networking iShares (IGN) gained .39%, but the Internet ETF (FDN) lost .47%. There was some strength in the materials sector as the Gold Miners ETF (GDX), Metals & Mining SPDR (XME) and Steel ETF (SLX) gained.
**This chart analysis is for educational purposes only, and should not
be construed as a recommendation to buy, sell or sell-short said securities**
Short-term Overview (Tuesday, 10-February-2015):
- Short-term breadth turned bullish on 21-Jan and remains bullish.
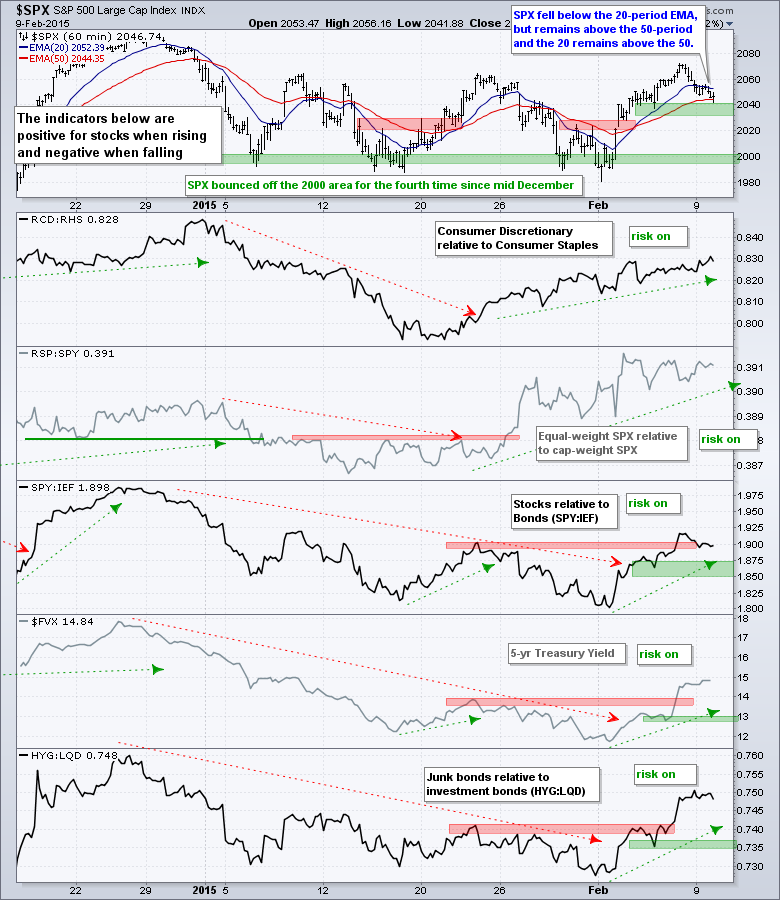
- All five risk indicators are positive.
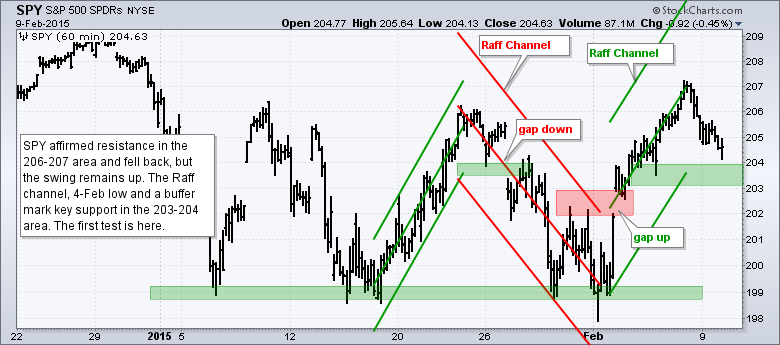
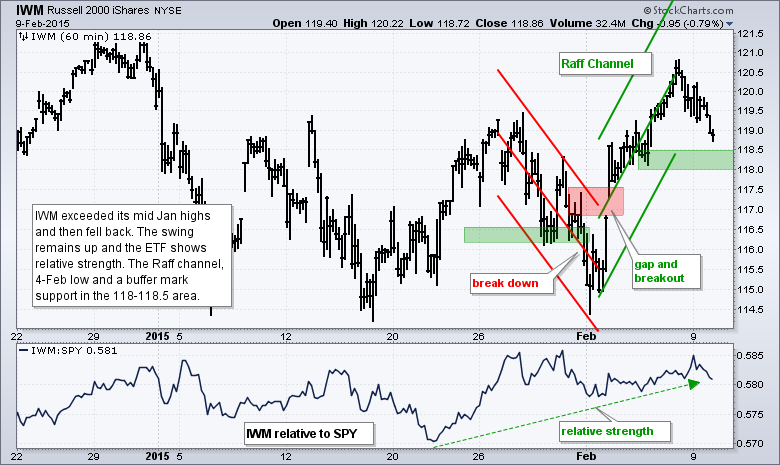
- SPY and IWM fell back on Friday-Monday, but remain within upswings and above support zones.
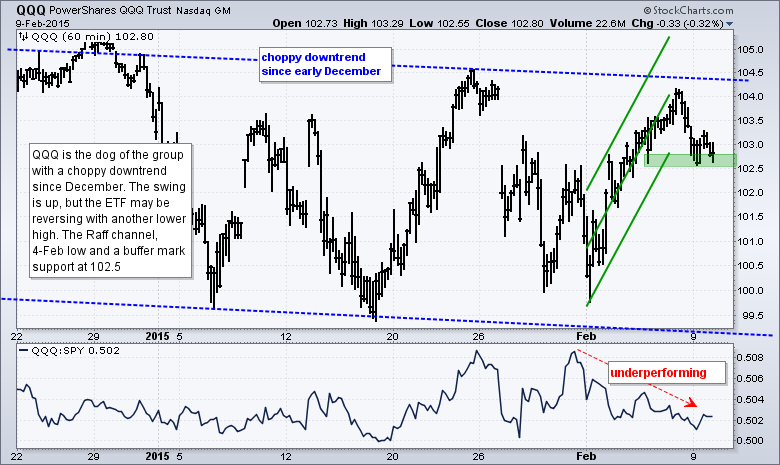
- QQQ is in an upswing, but shows relative weakness and did not exceed its late January high.
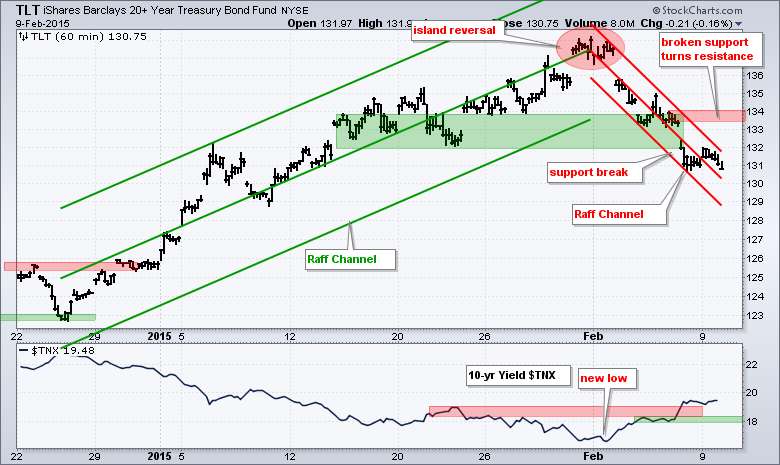
- TLT broke short-term support on Friday and the short-term trend is down.
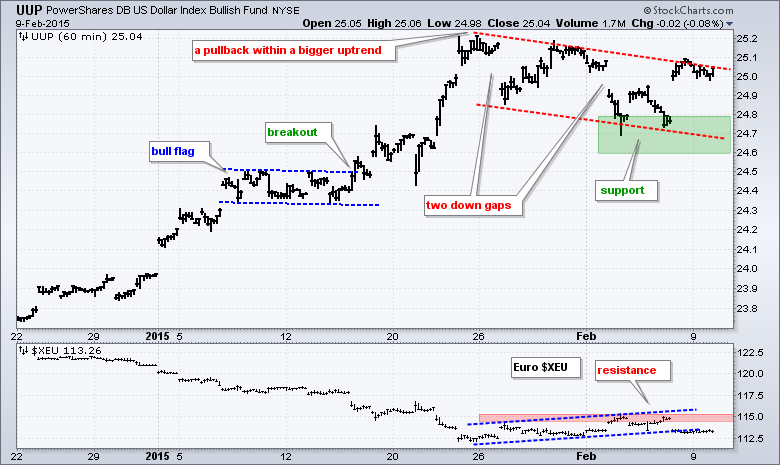
- UUP is challenging the upper trend line of a flag-like pullback.
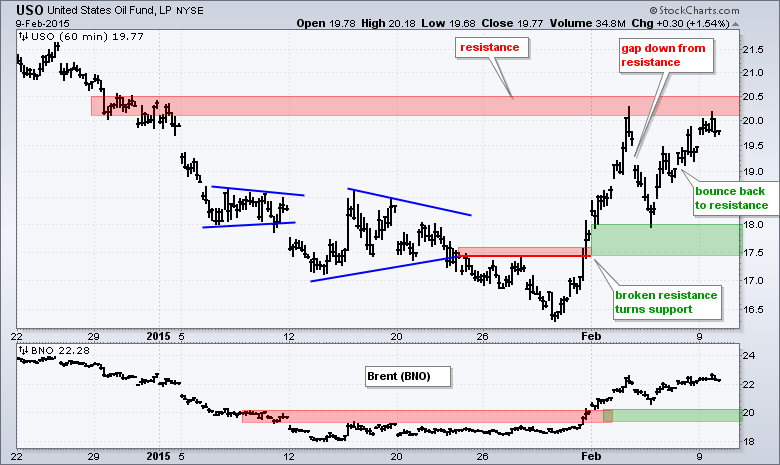
- USO is choppy and untradeable.
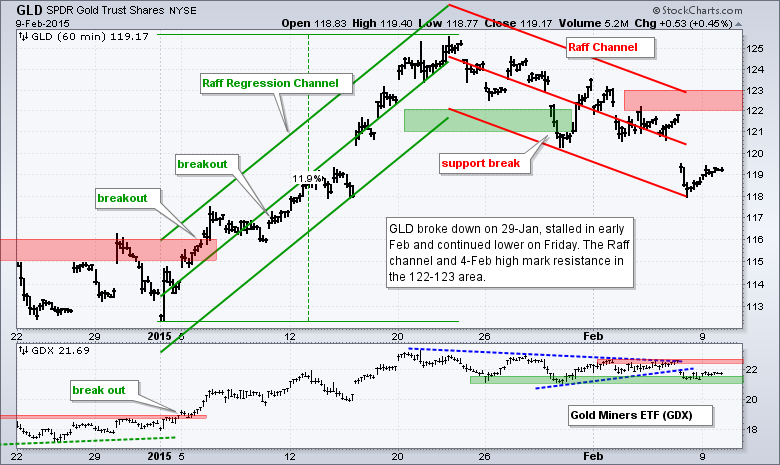
- GLD broke down on 29-Jan and remains in a short-term downtrend.
The E-mini fell back below 2050, but selling pressure was rather tame and the majority of Thursday's big gains are still holding. Overall, the E-mini is hitting resistance from a familiar spot: the 2050-2070 area and remains in a trading range.
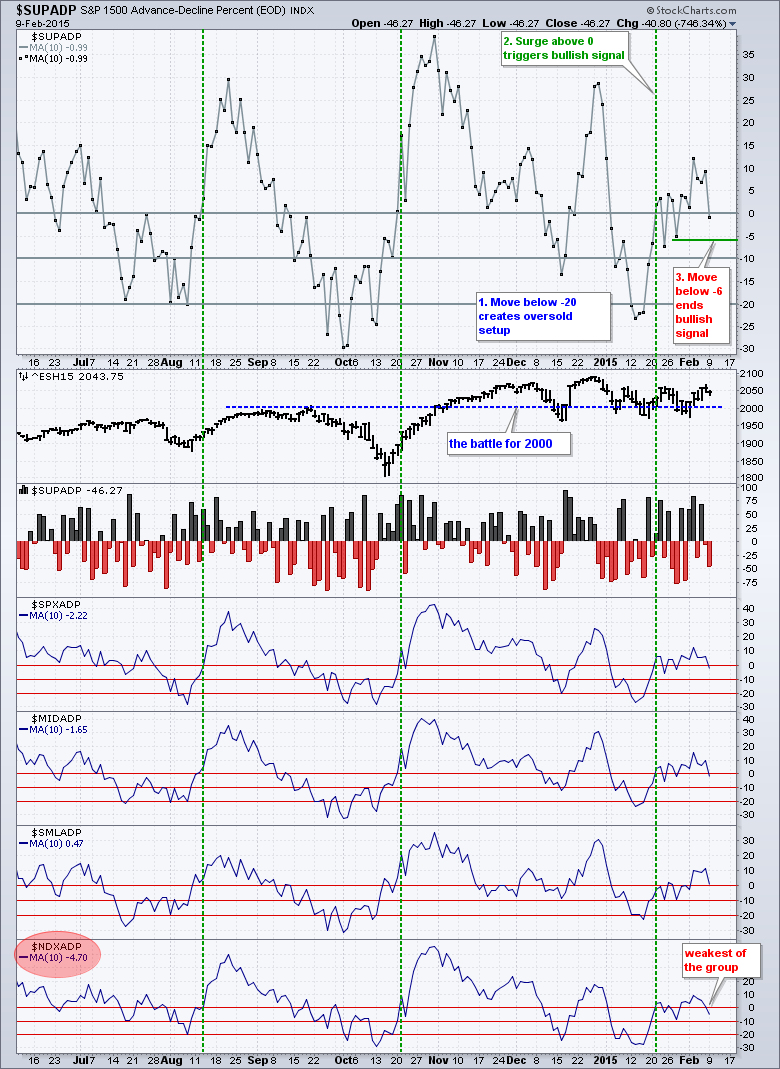
The 10-day SMA for S&P 1500 AD Percent ($SUPADP) dipped into negative territory on Monday. This is because the 10-day average lost a positive day (11 days ago) and gained a negative day (Monday). S&P 1500 AD Percent ($SUPADP) was -50% ten days ago and this negative value will be dropped tomorrow. This means it would take a -90% down day to push the 10-day SMA below -6%. A -90% down day involves a lot of selling pressure and we would likely see support breaks in the major index ETFs. AD Percent for the Nasdaq 100 remains the weakest of the group.
All five risk indicators remain positive. The two stock-specific indicators have been rising since the second half of January and the three bond-related indicators turned up in February. Of note, the 5-year Treasury Yield ($FVX) broke well above its late January high and junk bonds are outperforming investment grade bonds (HYG:LQD).
Stocks pulled back from Friday afternoon until Monday, but the short-term evidence remains bullish. Breadth still favors a short-term uptrend, the risk indicators are positive for stocks and small-caps are leading. SPY and IWM held last week's breakouts and remain above support. QQQ shows relative weakness and remains a concern. Watch Google and Facebook for potential breakouts that could lift QQQ.
**************************************************************
**************************************************************
**************************************************************
**************************************************************
**************************************************************
**************************************************************
***************************************************************
Key Reports and Events (all times Eastern):
Tue - Feb 10 - 10:00 - JOLTS Jobs Report
Wed - Feb 11 - 07:00 - MBA Mortgage Index
Wed - Feb 11 - 10:30 - Oil Inventories
Thu - Feb 12 - 08:30 - Initial Jobless Claims
Thu - Feb 12 - 08:30 - Retail Sales
Thu - Feb 12 - 10:30 - Natural Gas Inventories
Fri - Feb 13 - 09:55 - Michigan Sentiment
Tue - Feb 17 - 08:30 - Empire Manufacturing
Tue - Feb 17 - 10:00 - NAHB Housing Market Index
Wed - Feb 18 - 07:00 - MBA Mortgage Index
Wed - Feb 18 - 08:30 - Housing Starts/Building Permits
Wed - Feb 18 - 08:30 - Producer Price Index (PPI)
Wed - Feb 18 - 09:15 - Industrial Production
Wed - Feb 18 - 14:00 - FOMC Minutes
Thu - Feb 19 - 08:30 - Initial Jobless Claims
Thu - Feb 19 - 10:00 - Philadelphia Fed
Thu - Feb 19 - 10:00 - Leading Indicators
Thu - Feb 19 - 10:30 - Natural Gas Inventories
Thu - Feb 19 - 11:00 - Oil Inventories
Mon - Feb 23 - 10:00 - Existing Home Sales
Tue - Feb 24 - 09:00 - Case-Shiller 20-city Index
Tue - Feb 24 - 10:00 - Consumer Confidence
Wed - Feb 25 - 07:00 - MBA Mortgage Index
Wed - Feb 25 - 10:00 - New Home Sales
Wed - Feb 25 - 10:30 - Oil Inventories
Thu - Feb 26 - 08:30 - Initial Jobless Claims
Thu - Feb 26 - 08:30 - Consumer Price Index (CPI)
Thu - Feb 26 - 08:30 - Durable Goods Orders
Thu - Feb 26 - 09:00 - FHFA Housing Price Index
Thu - Feb 26 - 10:30 - Natural Gas Inventories
Fri - Feb 27 - 08:30 - GDP
Fri - Feb 27 - 09:45 - Chicago PMI
Fri - Feb 27 - 09:55 - Michigan Sentiment
Fri - Feb 27 - 10:00 - Pending Home Sales
This commentary is designed to stimulate thinking. This analysis is not a recommendation to buy, sell, hold or sell short any security (stock ETF or otherwise). We all need to think for ourselves when it comes to trading our own accounts. First, it is the only way to really learn. Second, we are the only ones responsible for our decisions. Think of these charts as food for further analysis. Before making a trade, it is important to have a plan. Plan the trade and trade the plan. Among other things, this includes setting a trigger level, a target area and a stop-loss level. It is also important to plan for three possible price movements: advance, decline or sideways. Have a plan for all three scenarios BEFORE making the trade. Consider possible holding times. And finally, look at overall market conditions and sector/industry performance.
