Stocks opened strong, dipped in the afternoon and then finished strong. Once again, the price action during the day is bullish and buying pressure continues to assert itself. The major index ETFs closed with fractional gains. The sectors were mixed with small gains and losses. Consumer discretionary, utilities and consumer staples were weak. Healthcare and finance were strong. Banks may benefit from the sharp decline in long-term Treasury yields because yield curve widen this month. The Regional Bank SPDR (KRE) advanced .88% on the day.
**This chart analysis is for educational purposes only, and should not
be construed as a recommendation to buy, sell or sell-short said securities**
Short-term Overview (Wednesday, 18-February-2015):
- Short-term breadth remains bullish overall.
- All five risk indicators are positive.
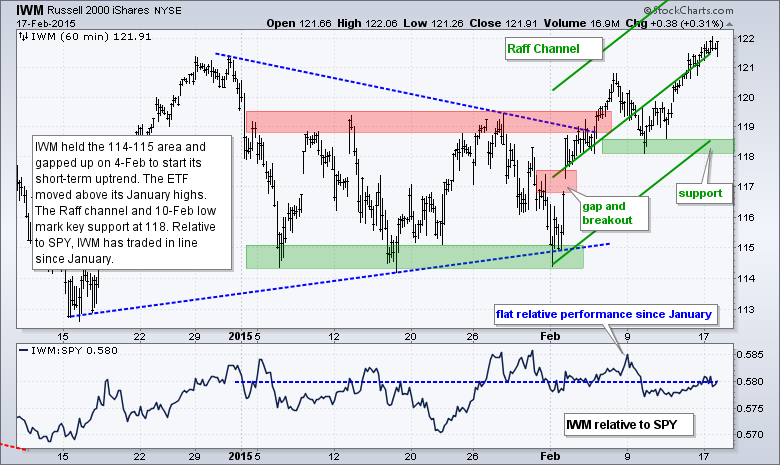
- SPY, QQQ and IWM are in short-term uptrends, but short-term overbought after big moves this month.
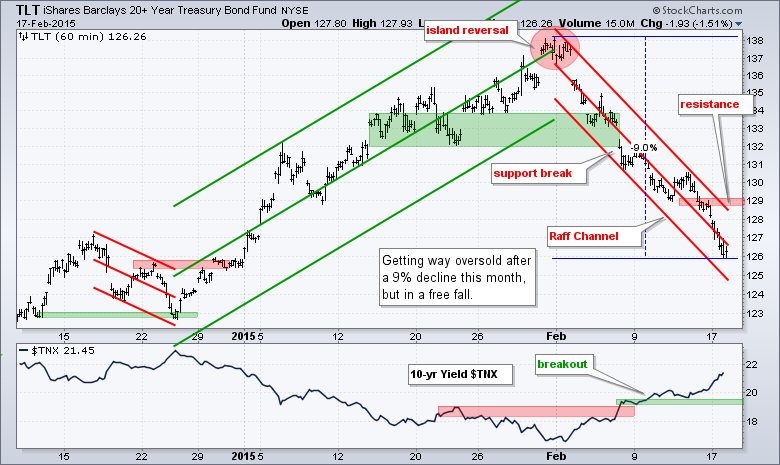
- TLT blew past its 62% retracement and remains in a free fall.
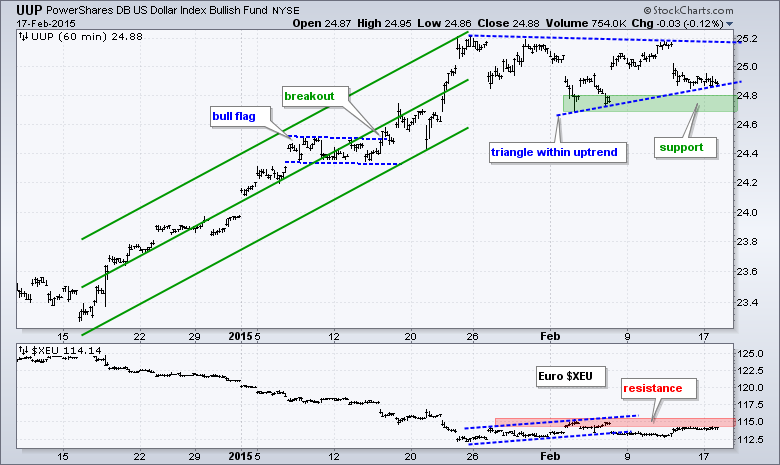
- UUP remains in a triangle consolidation.
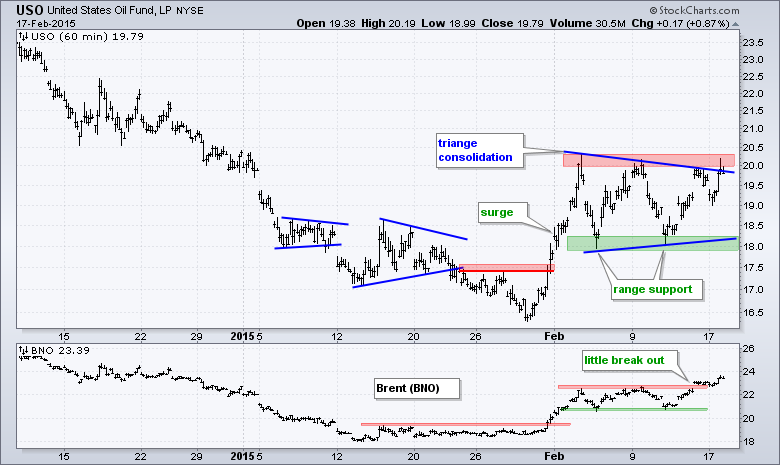
- USO is challenging the upper trend line of a triangle.
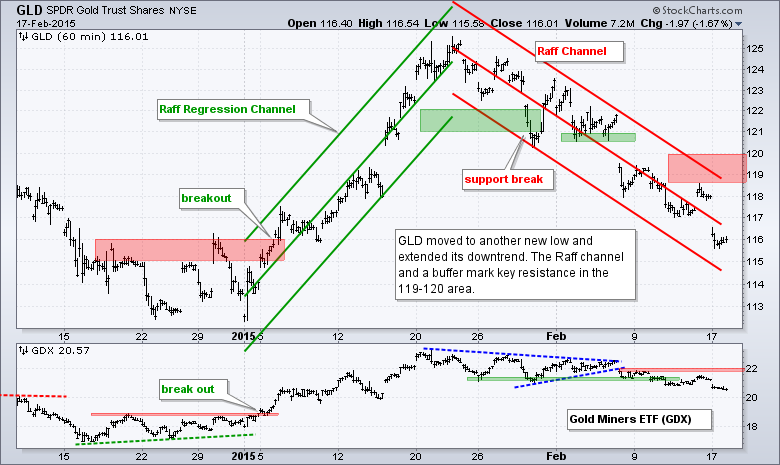
- GLD broke down on 29-Jan and extended its downtrend again this week.
The E-mini inched higher again on Monday and scored another new high. Overall, the triangle breakout is the dominant chart feature on this daily chart. The breakout zone around 2050 marks the first support area to watch on a pullback.
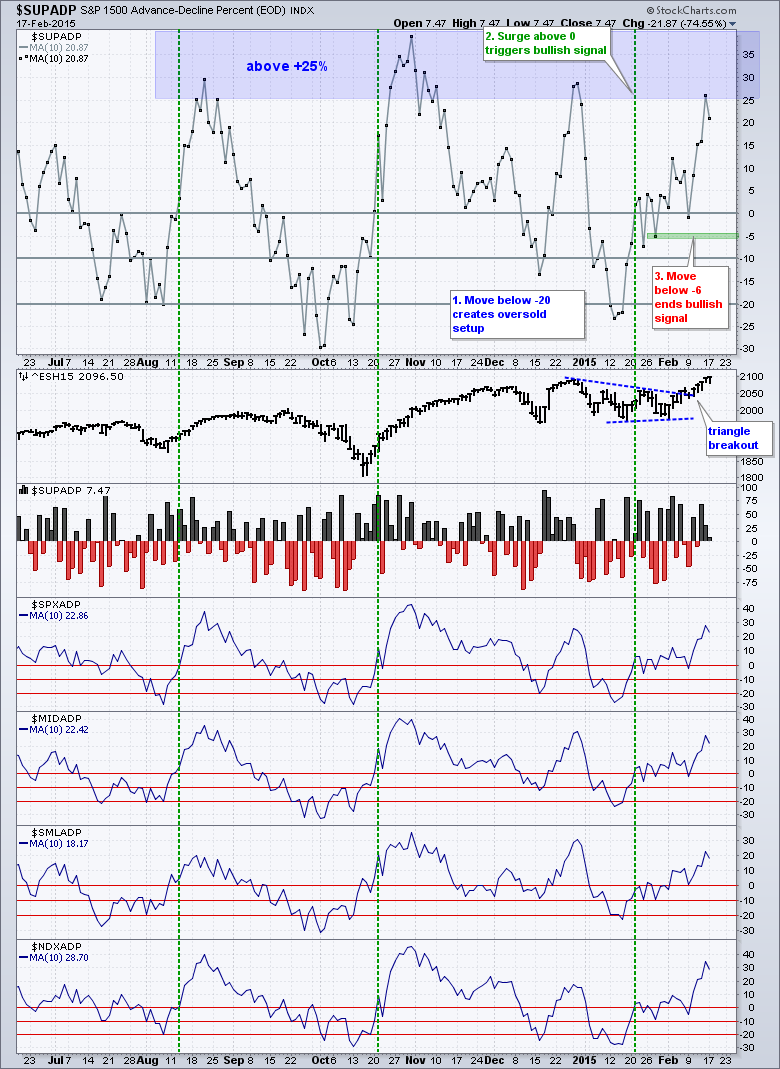
Breadth remains short-term bullish. S&P 1500 AD Percent ($SUPADP) finished slightly positive on Monday (+7.47%), which means advancers barely edged out decliners. The 10-day SMA for AD Percent fell back from overbought territory (>25%), but remains positive overall and well above the zero line.
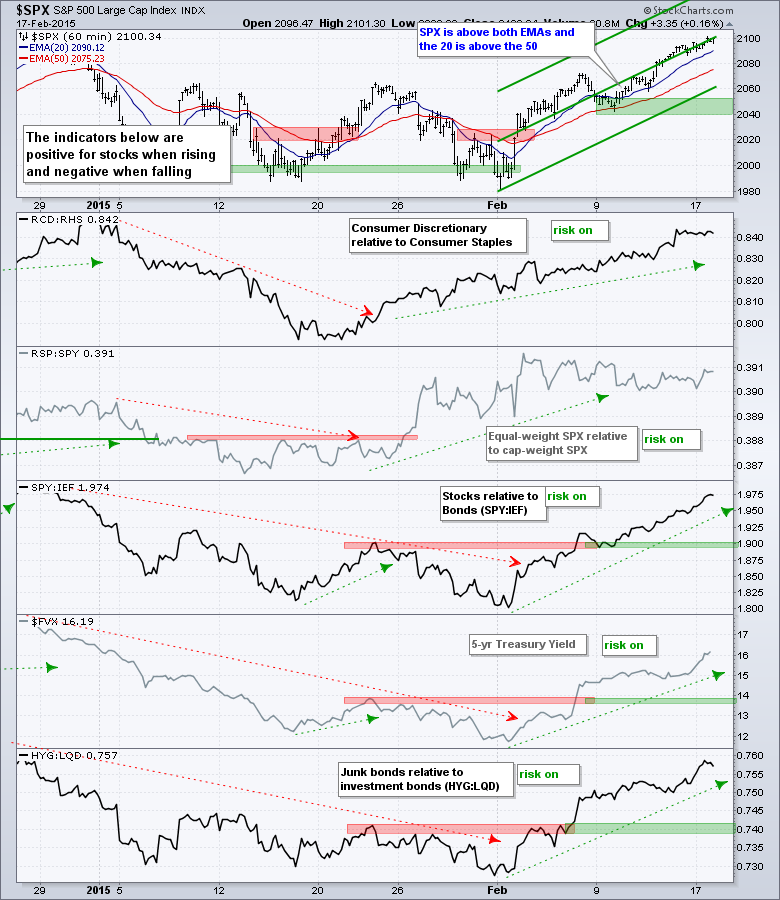
All five risk indicators remain positive for stocks. Treasury bonds fell off a cliff this month and this means Treasury yields surged. The SPY:IEF ratio moved to its highest level of the year as stocks outperform bonds. The 5-year Treasury Yield ($FVX) is at its highest level since early January and the yield curve is expanding again. This could help banks.
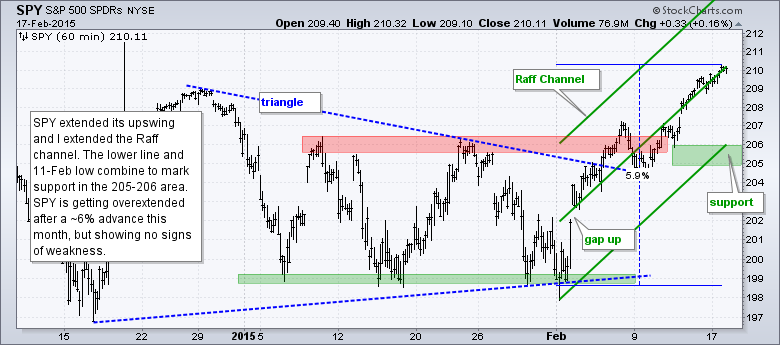
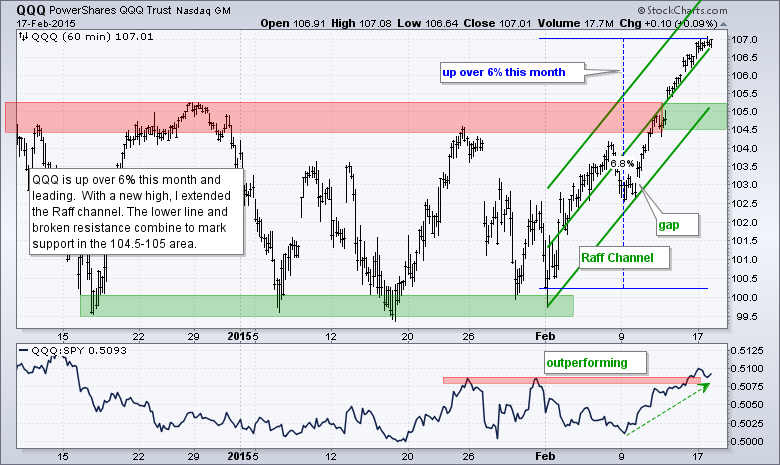
The short-term evidence remains bullish, but the major index ETFs are getting a little overbought because SPY, IWM and QQQ are up over 5% month-to-date. Money has poured out of Treasury bonds and T-Bond ETFs, and this money may find its way into the stock market. I raised support for SPY and QQQ, but left support unchanged for IWM.
**************************************************************
**************************************************************
**************************************************************
**************************************************************
**************************************************************
**************************************************************
***************************************************************
Key Reports and Events (all times Eastern):
Tue - Feb 17 - 10:00 - NAHB Housing Market Index
Wed - Feb 18 - 07:00 - MBA Mortgage Index
Wed - Feb 18 - 08:30 - Housing Starts/Building Permits
Wed - Feb 18 - 08:30 - Producer Price Index (PPI)
Wed - Feb 18 - 09:15 - Industrial Production
Wed - Feb 18 - 14:00 - FOMC Minutes
Thu - Feb 19 - 08:30 - Initial Jobless Claims
Thu - Feb 19 - 10:00 - Philadelphia Fed
Thu - Feb 19 - 10:00 - Leading Indicators
Thu - Feb 19 - 10:30 - Natural Gas Inventories
Thu - Feb 19 - 11:00 - Oil Inventories
Mon - Feb 23 - 10:00 - Existing Home Sales
Tue - Feb 24 - 09:00 - Case-Shiller 20-city Index
Tue - Feb 24 - 10:00 - Consumer Confidence
Wed - Feb 25 - 07:00 - MBA Mortgage Index
Wed - Feb 25 - 10:00 - New Home Sales
Wed - Feb 25 - 10:30 - Oil Inventories
Thu - Feb 26 - 08:30 - Initial Jobless Claims
Thu - Feb 26 - 08:30 - Consumer Price Index (CPI)
Thu - Feb 26 - 08:30 - Durable Goods Orders
Thu - Feb 26 - 09:00 - FHFA Housing Price Index
Thu - Feb 26 - 10:30 - Natural Gas Inventories
Fri - Feb 27 - 08:30 - GDP
Fri - Feb 27 - 09:45 - Chicago PMI
Fri - Feb 27 - 09:55 - Michigan Sentiment
Fri - Feb 27 - 10:00 - Pending Home Sales
This commentary is designed to stimulate thinking. This analysis is not a recommendation to buy, sell, hold or sell short any security (stock ETF or otherwise). We all need to think for ourselves when it comes to trading our own accounts. First, it is the only way to really learn. Second, we are the only ones responsible for our decisions. Think of these charts as food for further analysis. Before making a trade, it is important to have a plan. Plan the trade and trade the plan. Among other things, this includes setting a trigger level, a target area and a stop-loss level. It is also important to plan for three possible price movements: advance, decline or sideways. Have a plan for all three scenarios BEFORE making the trade. Consider possible holding times. And finally, look at overall market conditions and sector/industry performance.
