Stocks started the day with some mild selling pressure, firmed during the day and then rallied in the final two hours. The rally, however, was not that strong and the major index ETFs closed mixed on the day. QQQ was up a fraction and DIA was down a fraction. The sector action was also mixed with selling pressure hitting financials and energy. A little uptick in long-term Treasury bonds was enough to weigh on banks as the Regional Bank SPDR (KRE) fell 1.9%. Strength in bonds triggered an oversold bounce in utilities as XLU bounced off its support zone with a 2+ percent gain.
**This chart analysis is for educational purposes only, and should not
be construed as a recommendation to buy, sell or sell-short said securities**
Short-term Overview (Thursday, 19-February-2015):
- Short-term breadth remains bullish overall, but stalling.
- All five risk indicators are positive, but Treasuries ticked up on Wednesday.
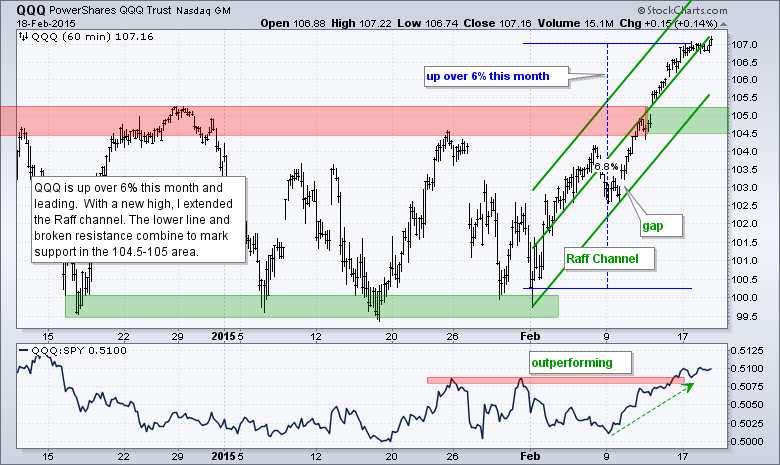
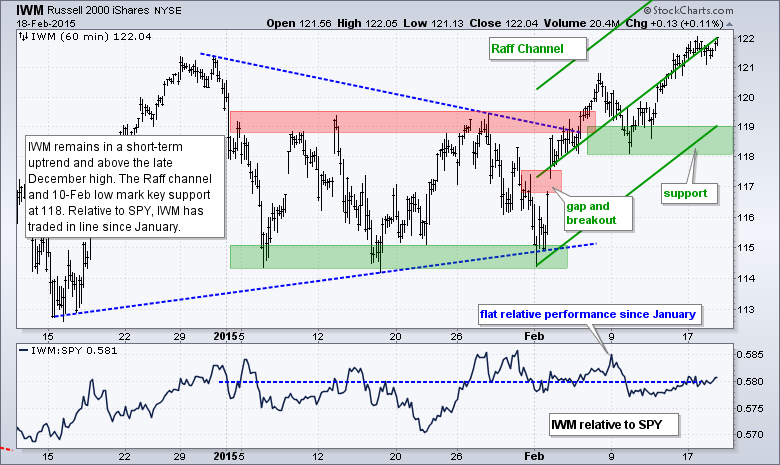
- SPY, QQQ and IWM are in short-term uptrends, but short-term overbought after big moves this month.
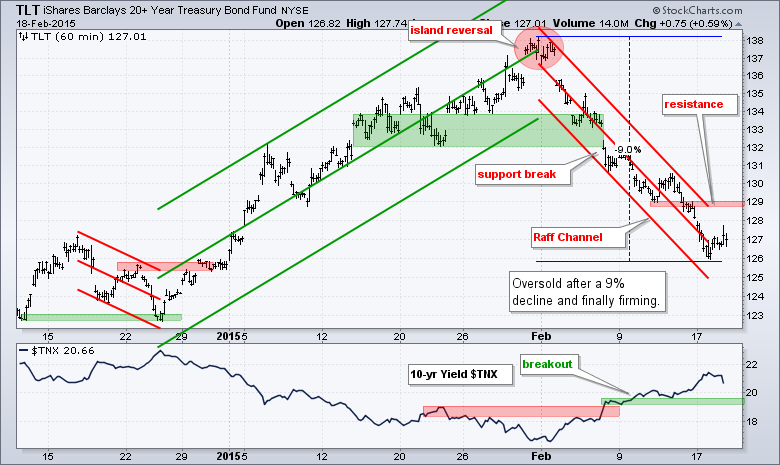
- TLT is oversold and finally firming with a small bounce.
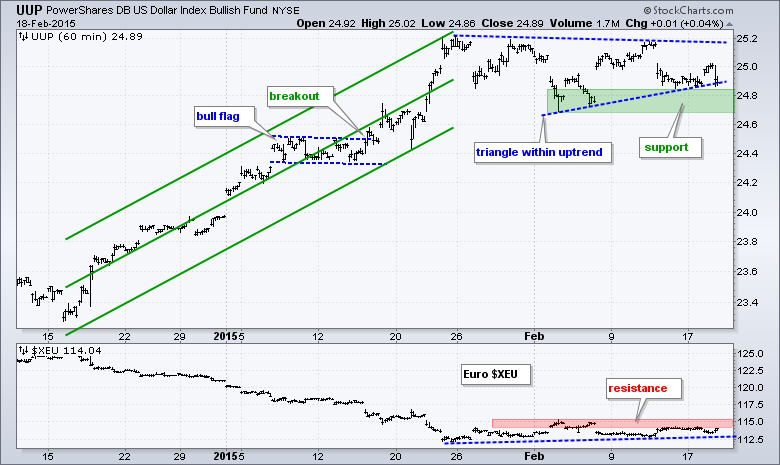
- UUP is testing the lower trend line of a triangle as the Euro hangs on the Greek negotiations.
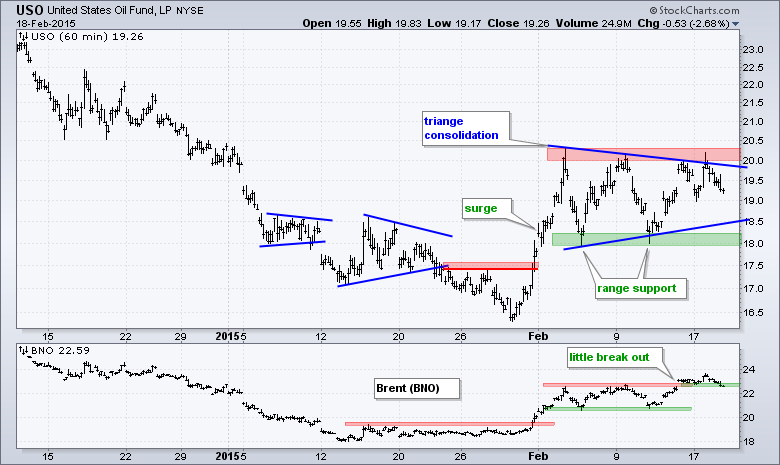
- USO fell back from range resistance and could head to range support.
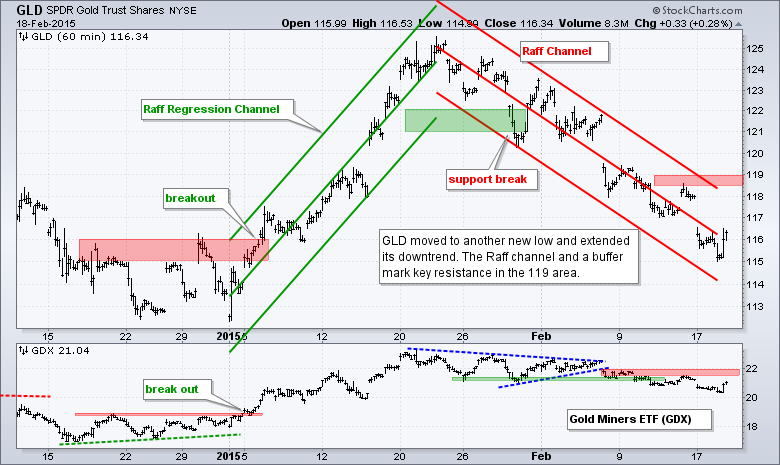
- GLD broke down on 29-Jan and extended its downtrend again this week.
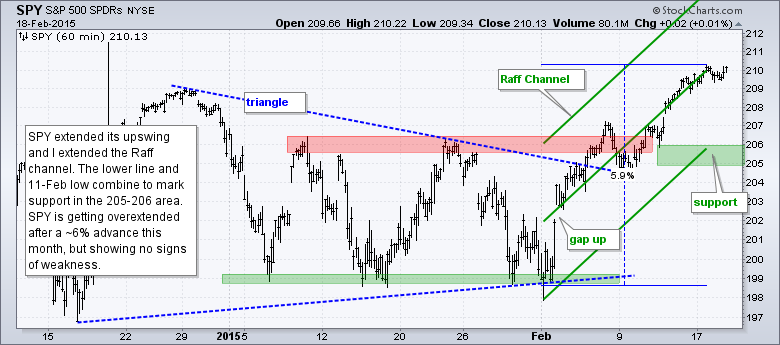
The E-mini stalled on Wednesday and formed its narrowest range of the year. This narrow range day shows indecision that can sometimes foreshadow a short-term reversal. I am not talking a short-term trend reversal, but a short-term reversal that could trigger a pullback to the January highs. These broken resistance levels turn into the first support zones to watch.
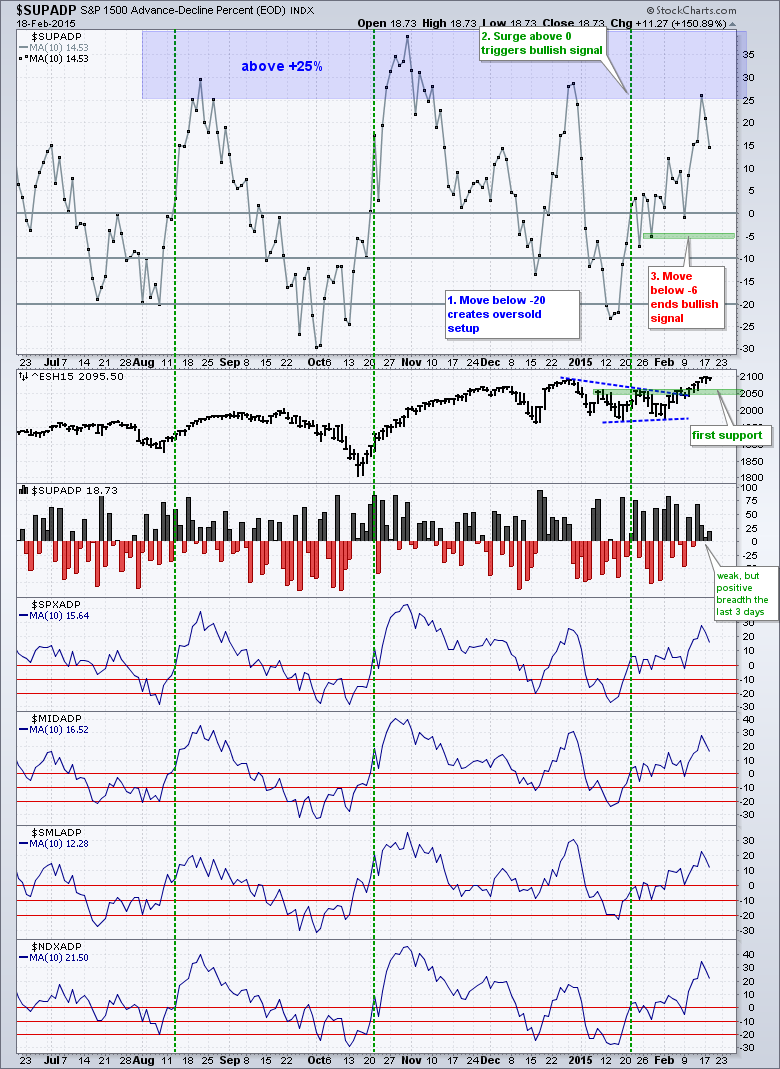
Breadth remains short-term bullish overall. S&P 1500 AD Percent ($SUPADP) was weak, but positive, the last three days. These weak readings caused the 10-day SMA for S&P 1500 AD Percent ($SUPADP) to decline from overbought levels the last two sessions.
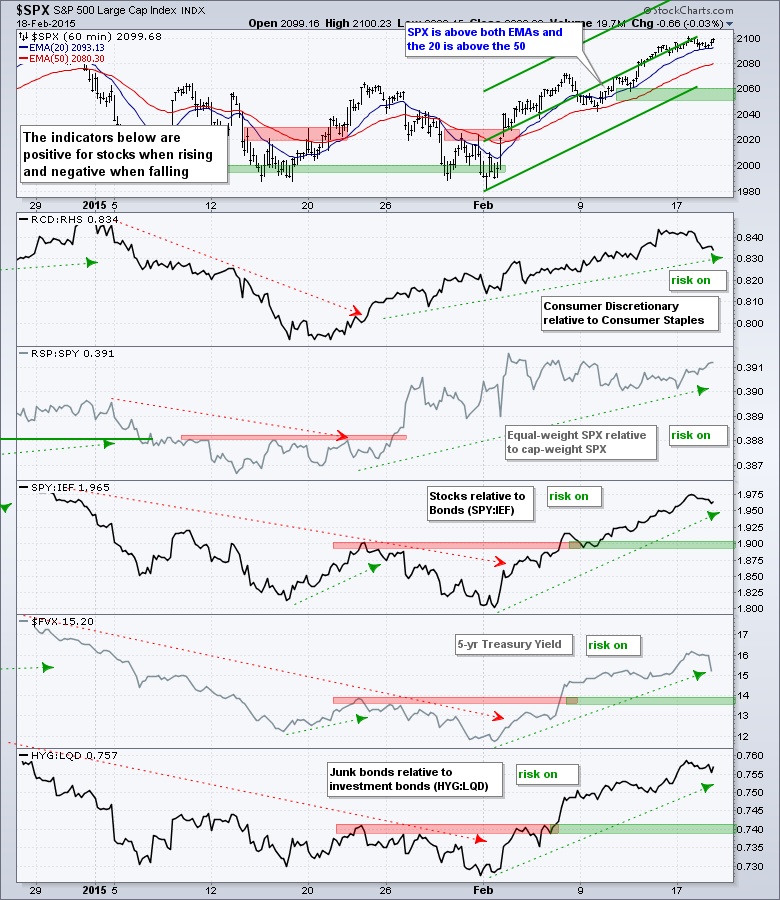
All five risk indicators remain positive for stocks. Treasury bonds finally bounced and the three bond-related indicators turned down the last few days. All three are still in uptrends though. The 5-year Treasury Yield ($FVX) fell quite sharply as money moved into short-term Treasuries after the Fed minutes were released on Wednesday.
The short-term evidence remains bullish, but the major index ETFs are overbought and stalling. Breadth is stalling as well and Treasury bonds could get an oversold bounce. The combination suggests that a pullback may be in order for stocks.
**************************************************************
**************************************************************
**************************************************************
**************************************************************
**************************************************************
**************************************************************
***************************************************************
Key Reports and Events (all times Eastern):
Thu - Feb 19 - 08:30 - Initial Jobless Claims
Thu - Feb 19 - 10:00 - Philadelphia Fed
Thu - Feb 19 - 10:00 - Leading Indicators
Thu - Feb 19 - 10:30 - Natural Gas Inventories
Thu - Feb 19 - 11:00 - Oil Inventories
Mon - Feb 23 - 10:00 - Existing Home Sales
Tue - Feb 24 - 09:00 - Case-Shiller 20-city Index
Tue - Feb 24 - 10:00 - Consumer Confidence
Wed - Feb 25 - 07:00 - MBA Mortgage Index
Wed - Feb 25 - 10:00 - New Home Sales
Wed - Feb 25 - 10:30 - Oil Inventories
Thu - Feb 26 - 08:30 - Initial Jobless Claims
Thu - Feb 26 - 08:30 - Consumer Price Index (CPI)
Thu - Feb 26 - 08:30 - Durable Goods Orders
Thu - Feb 26 - 09:00 - FHFA Housing Price Index
Thu - Feb 26 - 10:30 - Natural Gas Inventories
Fri - Feb 27 - 08:30 - GDP
Fri - Feb 27 - 09:45 - Chicago PMI
Fri - Feb 27 - 09:55 - Michigan Sentiment
Fri - Feb 27 - 10:00 - Pending Home Sales
This commentary is designed to stimulate thinking. This analysis is not a recommendation to buy, sell, hold or sell short any security (stock ETF or otherwise). We all need to think for ourselves when it comes to trading our own accounts. First, it is the only way to really learn. Second, we are the only ones responsible for our decisions. Think of these charts as food for further analysis. Before making a trade, it is important to have a plan. Plan the trade and trade the plan. Among other things, this includes setting a trigger level, a target area and a stop-loss level. It is also important to plan for three possible price movements: advance, decline or sideways. Have a plan for all three scenarios BEFORE making the trade. Consider possible holding times. And finally, look at overall market conditions and sector/industry performance.


