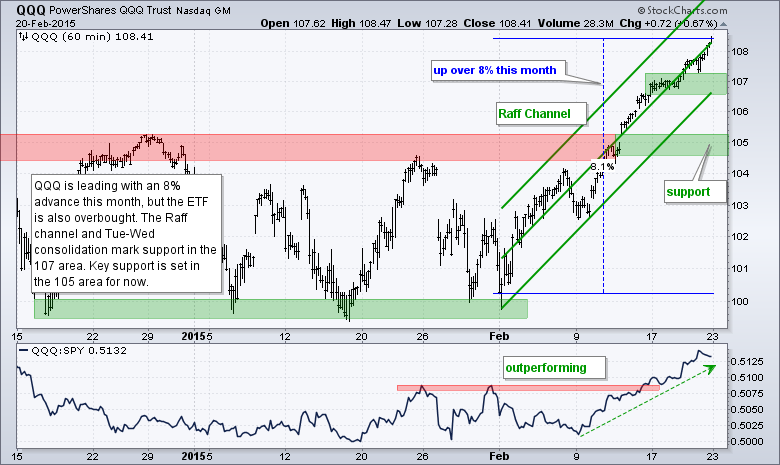
Even though the major index ETFs are short-term overbought, stocks continue to exhibit bullish price action overall. For example, the S&P 500 fell over 10 points and dipped below 2087 in the first thirty minutes on Friday, but quickly found its footing and advanced the rest of the day. The index closed at a new all time high (2110), as did the Nasdaq 100 and Dow Industrials. Large-cap techs led the market last week as QQQ gained 1.40%. Industrials and healthcare led the sectors higher. The finance sector was relatively weak as XLF gained just .04%, the Equal-weight Finance ETF (RYF) declined .02% and the SmallCap Financials ETF (PSCF) fell .41%.
**This chart analysis is for educational purposes only, and should not
be construed as a recommendation to buy, sell or sell-short said securities**
Short-term Overview (Monday, 23-February-2015):
- Short-term breadth remains bullish overall.
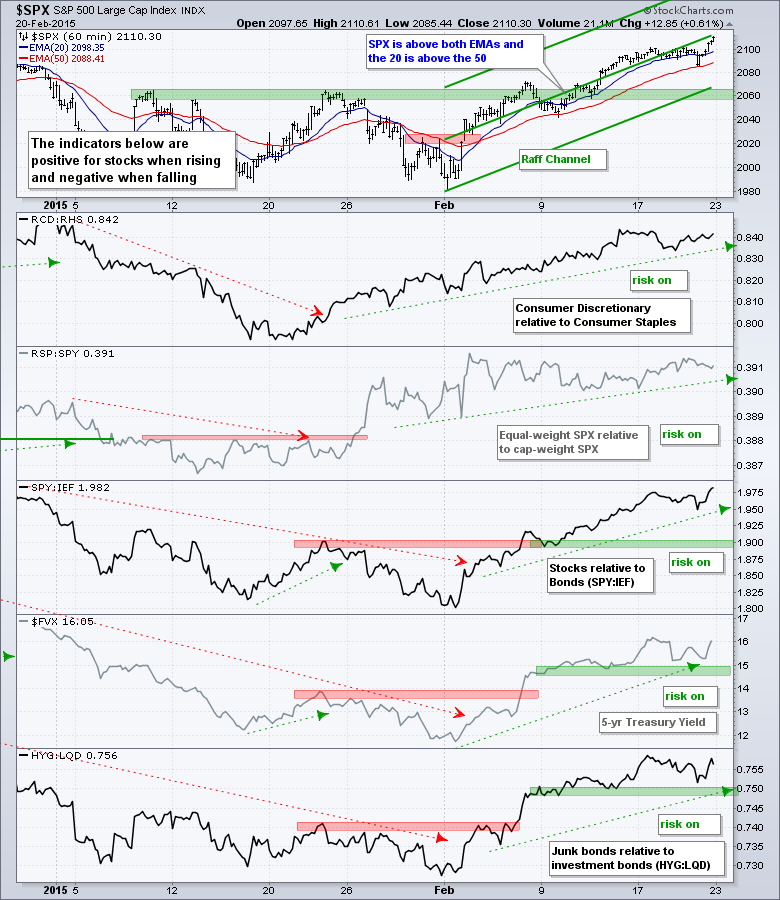
- All five risk indicators are positive.
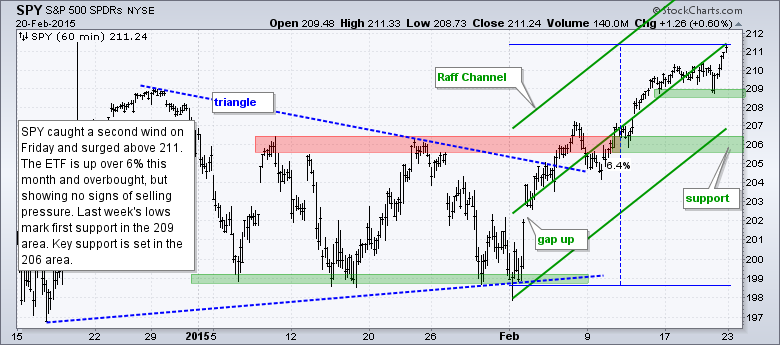
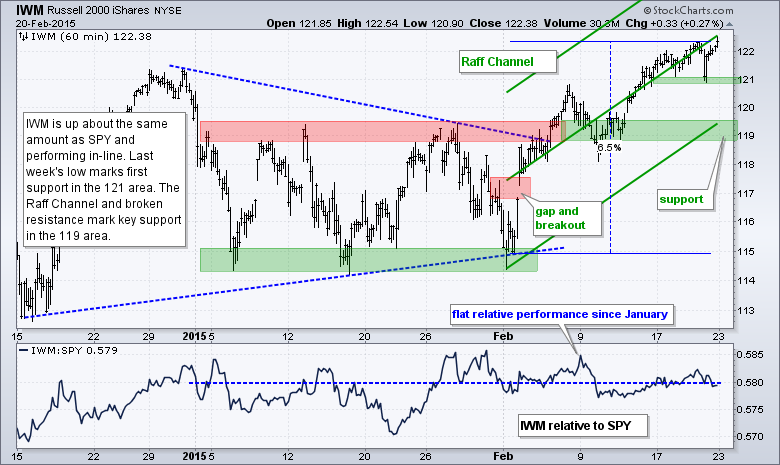
- SPY, QQQ and IWM are in short-term uptrends, but overbought after big moves this month.
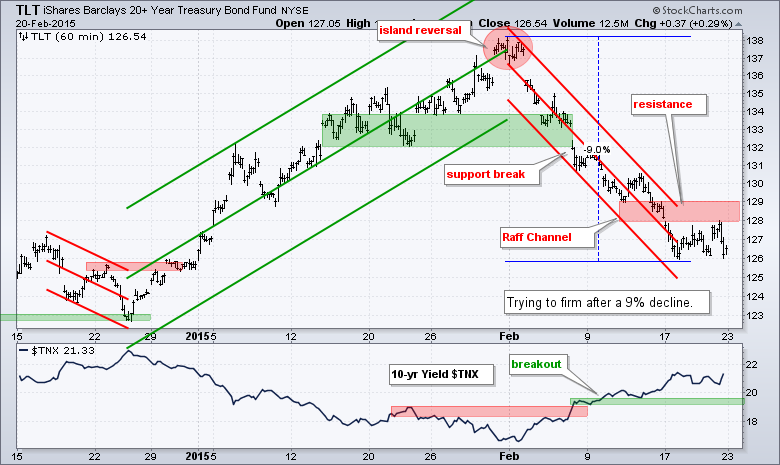
- TLT became oversold after a 9% decline and firmed last week.
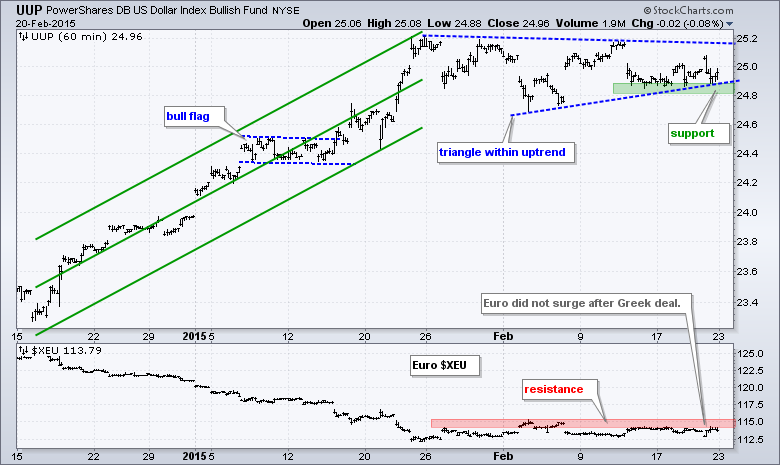
- UUP is firming near the lower trend line of a triangle and within an uptrend overall.
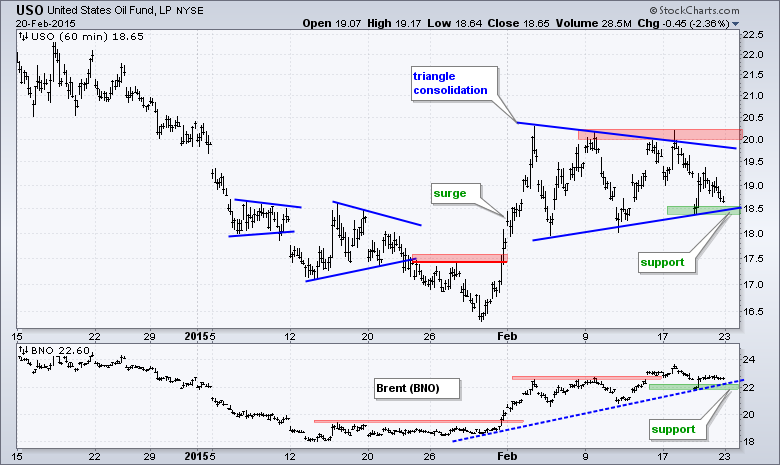
- USO fell back from range support and buying pressure remains weak.
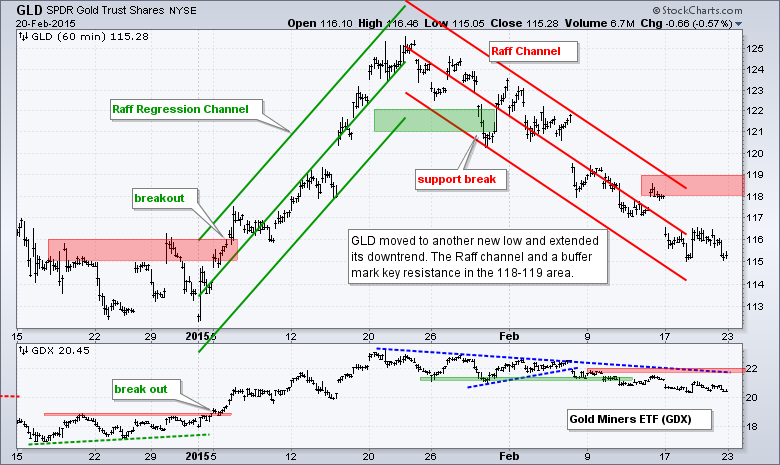
- GLD broke down on 29-Jan and extended its downtrend again last week.
The E-mini rallied in the afternoon and closed at a new high, and above 2100 for the first time ever. On this daily chart, broken resistance turns first support in the 2050 area.
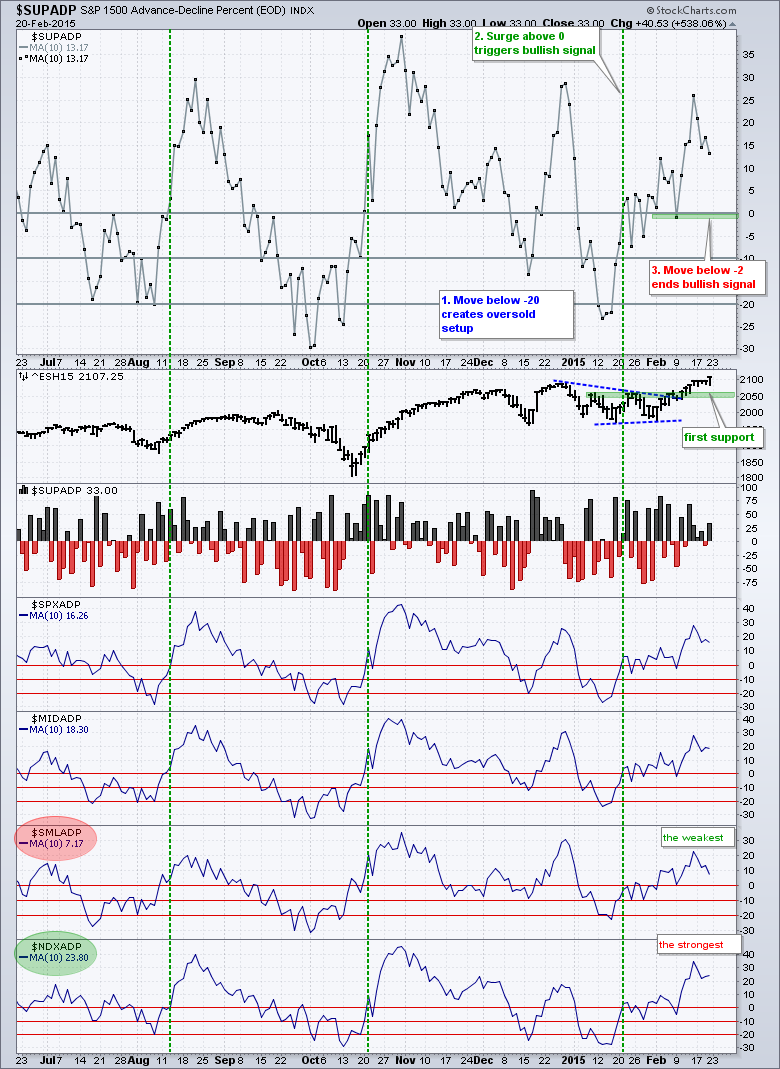
Breadth remains short-term bullish overall, but we are seeing some weakness in small-cap breadth. AD Percent exceeded +50% for the S&P 500, S&P MidCap 400 and Nasdaq 100 on Friday. S&P SmallCap AD Percent ($SMLADP), however, was barely positive and ended at +2.33%. The 10-day SMA for S&P SmallCap AD Percent is at 7.17% and the weakest of the group. All five 10-day SMAs for AD Percent are positive though. Moves into negative territory would suggest that short-term selling pressure is picking up.
All five risk indicators remain positive for stocks. Consumer discretionary is outperforming consumer staples and the Equal-Weight S&P 500 ETF (RSP) is outperforming the S&P 500 SPDR (SPY). The three bond-related indicators turned back up on Friday. Stocks are outperforming Treasuries, the 5-year Treasury Yield ($FVX) remains in an uptrend and junk bonds are outperforming investment-grade bonds.
The short-term evidence remains bullish for stocks, but the major index ETFs are short-term overbought. Overbought is not bearish. It just means we could see a pullback or consolidation to digest the February gains. All eyes will be on the bond market this week because Fed chair Janet Yellen will testify before Congress on Tuesday and Wednesday. Movements in Treasuries, and interest rates, could affect interest rate sensitive groups, such as banks, utilities and REITs.
**************************************************************
**************************************************************
**************************************************************
**************************************************************
**************************************************************
**************************************************************
***************************************************************
Key Reports and Events (all times Eastern):
Mon - Feb 23 - 10:00 - Existing Home Sales
Tue - Feb 24 - 09:00 - Case-Shiller 20-city Index
Tue - Feb 24 - 10:00 - Consumer Confidence
Tue - Feb 24 - 10:00 - Yellen Testifies before Congress
Wed - Feb 25 - 07:00 - MBA Mortgage Index
Wed - Feb 25 - 10:00 - New Home Sales
Wed - Feb 25 - 10:00 - Yellen Testifies before Congress
Wed - Feb 25 - 10:30 - Oil Inventories
Thu - Feb 26 - 08:30 - Initial Jobless Claims
Thu - Feb 26 - 08:30 - Consumer Price Index (CPI)
Thu - Feb 26 - 08:30 - Durable Goods Orders
Thu - Feb 26 - 09:00 - FHFA Housing Price Index
Thu - Feb 26 - 10:30 - Natural Gas Inventories
Fri - Feb 27 - 08:30 - GDP
Fri - Feb 27 - 09:45 - Chicago PMI
Fri - Feb 27 - 09:55 - Michigan Sentiment
Fri - Feb 27 - 10:00 - Pending Home Sales
This commentary is designed to stimulate thinking. This analysis is not a recommendation to buy, sell, hold or sell short any security (stock ETF or otherwise). We all need to think for ourselves when it comes to trading our own accounts. First, it is the only way to really learn. Second, we are the only ones responsible for our decisions. Think of these charts as food for further analysis. Before making a trade, it is important to have a plan. Plan the trade and trade the plan. Among other things, this includes setting a trigger level, a target area and a stop-loss level. It is also important to plan for three possible price movements: advance, decline or sideways. Have a plan for all three scenarios BEFORE making the trade. Consider possible holding times. And finally, look at overall market conditions and sector/industry performance.


