The S&P 500 has been flat as a pancake the last three days, but the Nasdaq 100 and Russell 2000 continued higher. Note that the S&P 500 is up .02% this week, the Nasdaq 100 is up .63% and the Russell 2000 is up .39%. The gains are not earth shattering, but relative strength in large-cap techs and small-caps is positive. Techs got a lift from Facebook on Thursday as the stock surged 3.53%. Elsewhere, the Consumer discretionary sector got a lift from Ford (F) as the stock advanced over 1%.
**This chart analysis is for educational purposes only, and should not
be construed as a recommendation to buy, sell or sell-short said securities**
Short-term Overview (Friday, 20-February-2015):
- Short-term breadth remains bullish overall.
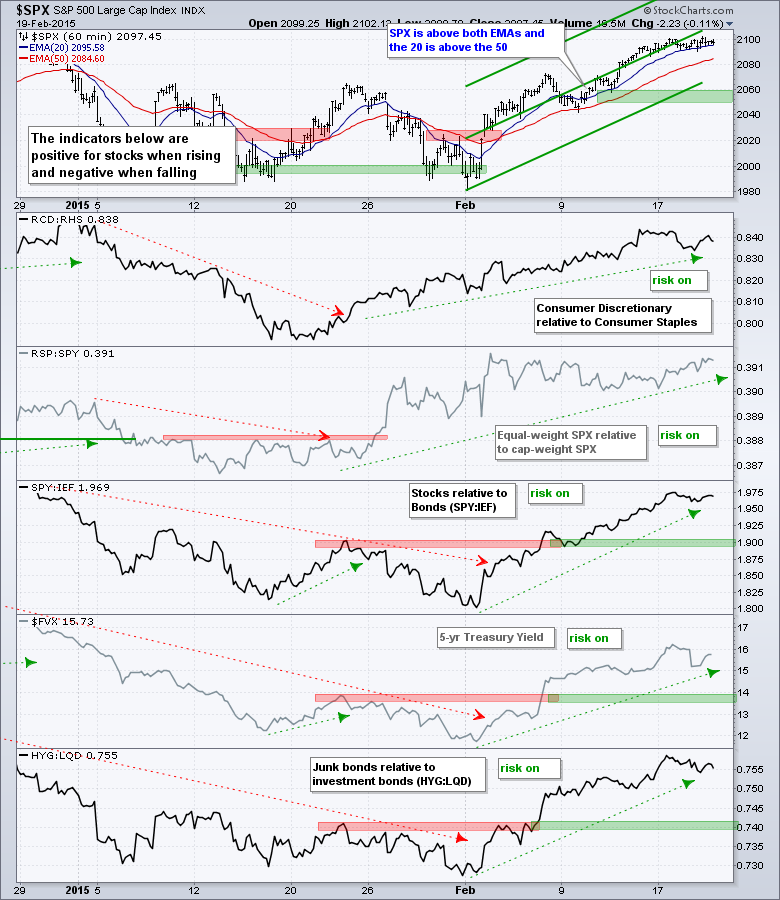
- All five risk indicators are positive.
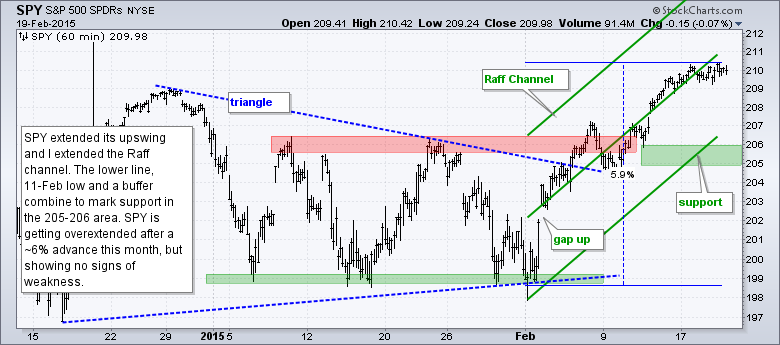
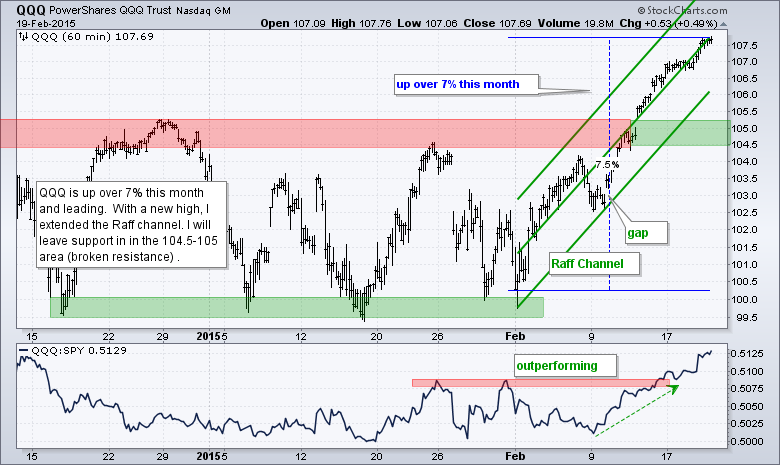
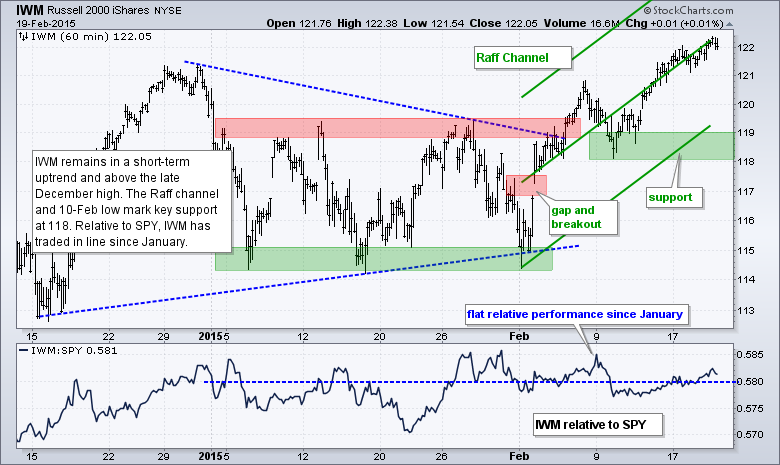
- SPY, QQQ and IWM are in short-term uptrends, but overbought after big moves this month.
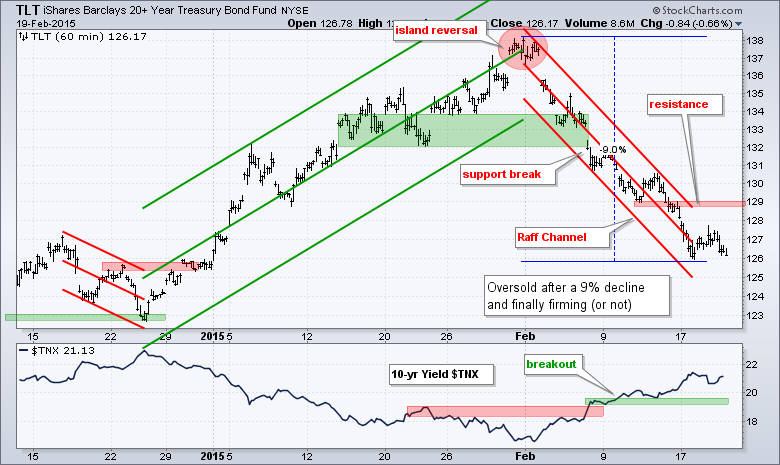
- TLT fell back again on Thursday and remains oversold.
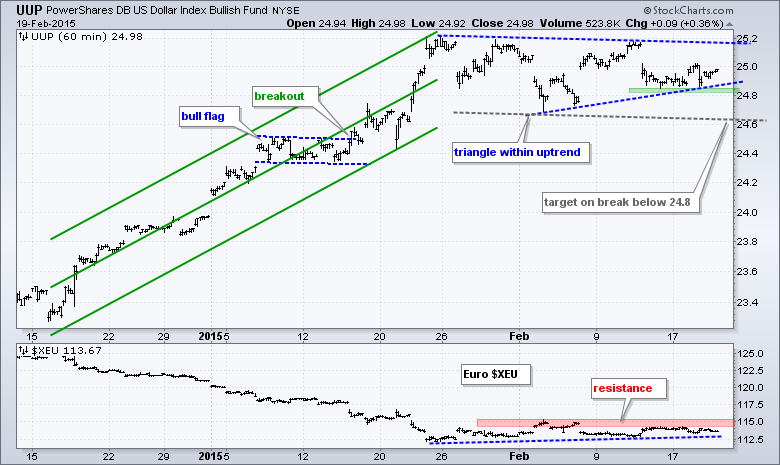
- UUP is testing the lower trend line of a triangle as the Euro hangs on the Greek negotiations.
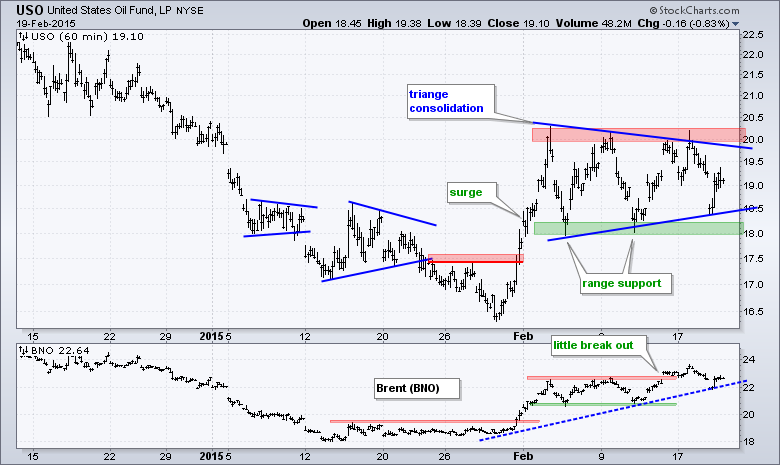
- USO remains stuck in a trading range.
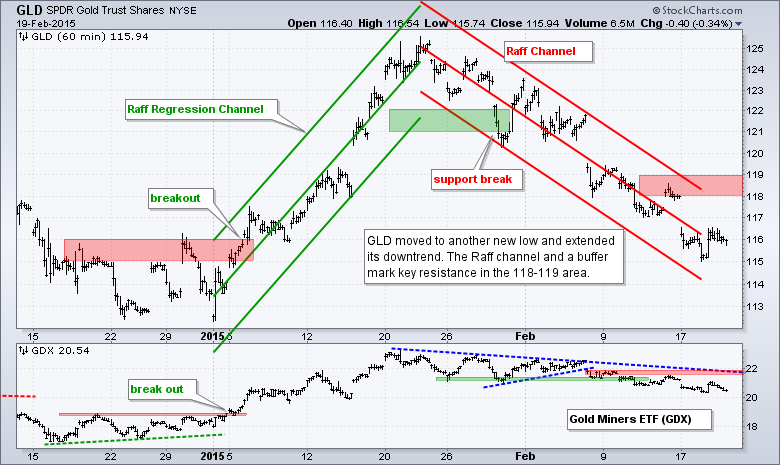
- GLD broke down on 29-Jan and extended its downtrend again this week.
The E-mini extended its stall and has now closed with a three point range the last four days. The intraday price movements have also been quite narrow the last two days, and yesterday marked the smallest high-low range of the year. Stalling just means buying and selling pressure have equalized. At this point it is just a small consolidation after a sharp advance (1990 to 2100).
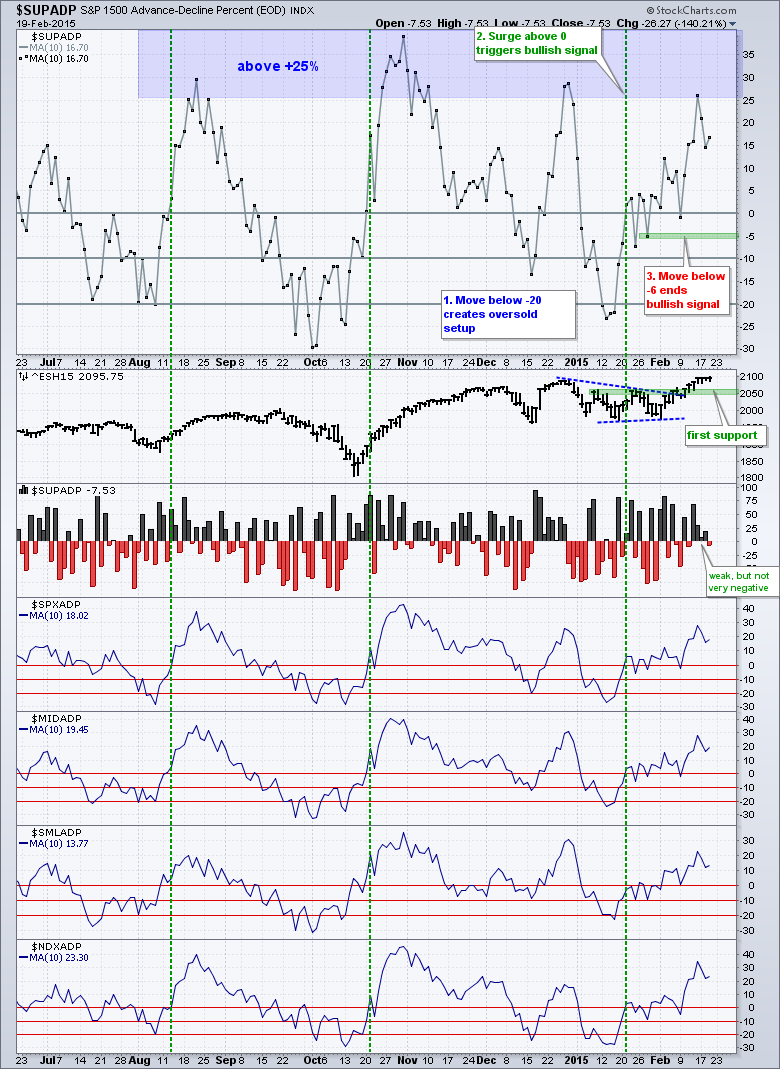
Breadth remains short-term bullish overall. S&P 1500 AD Percent ($SUPADP) dipped into negative territory on Thursday, but this negative dip was not deep at all and selling pressure was minimal. The 10-day SMA remains firmly in positive territory and not even close to a bearish signal.
All five risk indicators remain positive for stocks. Of note, the RSP:SPY ratio turned up this week as the Equal-Weight S&P 500 ETF (RSP) started outperforming the S&P 500 SPDR (SPY) again.
The short-term evidence remains bullish for stocks. The short-term situation, however, is challenging because stocks are overbought and we could see a 1-2% pullback in SPY or QQQ. At this point, I would like to allow room for a short pullback or consolidation within the short-term uptrend.
**************************************************************
**************************************************************
**************************************************************
**************************************************************
**************************************************************
**************************************************************
***************************************************************
Key Reports and Events (all times Eastern):
Mon - Feb 23 - 10:00 - Existing Home Sales
Tue - Feb 24 - 09:00 - Case-Shiller 20-city Index
Tue - Feb 24 - 10:00 - Consumer Confidence
Wed - Feb 25 - 07:00 - MBA Mortgage Index
Wed - Feb 25 - 10:00 - New Home Sales
Wed - Feb 25 - 10:30 - Oil Inventories
Thu - Feb 26 - 08:30 - Initial Jobless Claims
Thu - Feb 26 - 08:30 - Consumer Price Index (CPI)
Thu - Feb 26 - 08:30 - Durable Goods Orders
Thu - Feb 26 - 09:00 - FHFA Housing Price Index
Thu - Feb 26 - 10:30 - Natural Gas Inventories
Fri - Feb 27 - 08:30 - GDP
Fri - Feb 27 - 09:45 - Chicago PMI
Fri - Feb 27 - 09:55 - Michigan Sentiment
Fri - Feb 27 - 10:00 - Pending Home Sales
This commentary is designed to stimulate thinking. This analysis is not a recommendation to buy, sell, hold or sell short any security (stock ETF or otherwise). We all need to think for ourselves when it comes to trading our own accounts. First, it is the only way to really learn. Second, we are the only ones responsible for our decisions. Think of these charts as food for further analysis. Before making a trade, it is important to have a plan. Plan the trade and trade the plan. Among other things, this includes setting a trigger level, a target area and a stop-loss level. It is also important to plan for three possible price movements: advance, decline or sideways. Have a plan for all three scenarios BEFORE making the trade. Consider possible holding times. And finally, look at overall market conditions and sector/industry performance.


