Stocks started the day strong as the S&P 500 surged above 2115 in the first ninety minutes. The index pulled back to the 2110 area around midday and rebounded in the afternoon to close above 2115. Once again, the gains for the day were modest across the board. SPY gained a mere .28%, QQQ was up .07% and IWM surged a whopping .13%. Consumer discretionary and consumer staples led the sectors. The Home Construction iShares (ITB) and Semiconductor SPDR (XSD) led the industry group ETFs with 2+ percent gains. Both hit new 52-week highs as well. Even though stocks are overbought short-term, it is hard to argue with new highs in these two groups.
**This chart analysis is for educational purposes only, and should not
be construed as a recommendation to buy, sell or sell-short said securities**
Short-term Overview (Wednesday, 25-February-2015):
- Breadth has not been strong the last seven days, but has yet to turn bearish.
- Some risk aversion is creeping into the market.
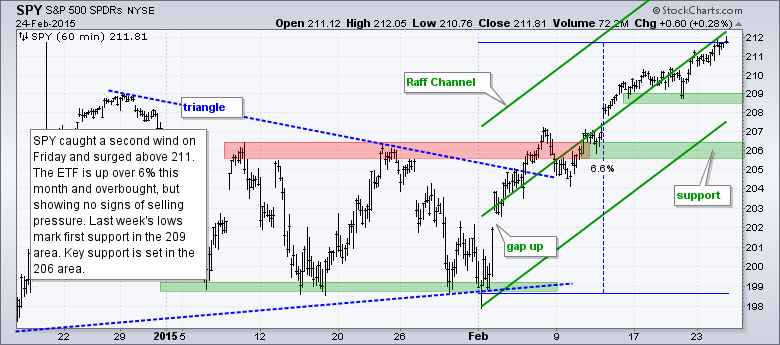
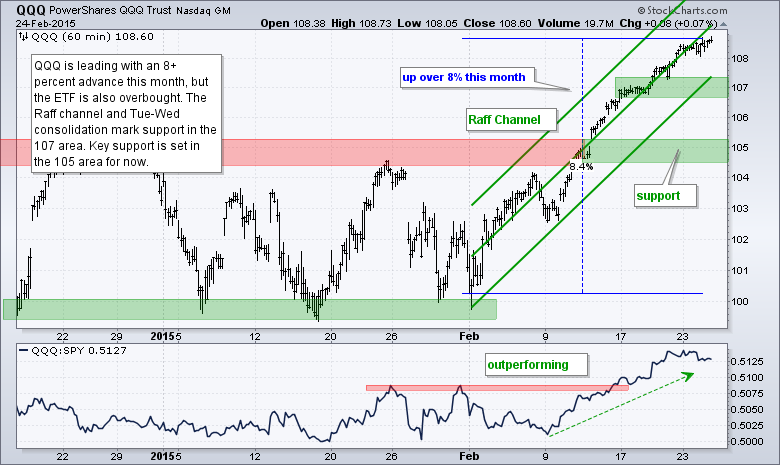
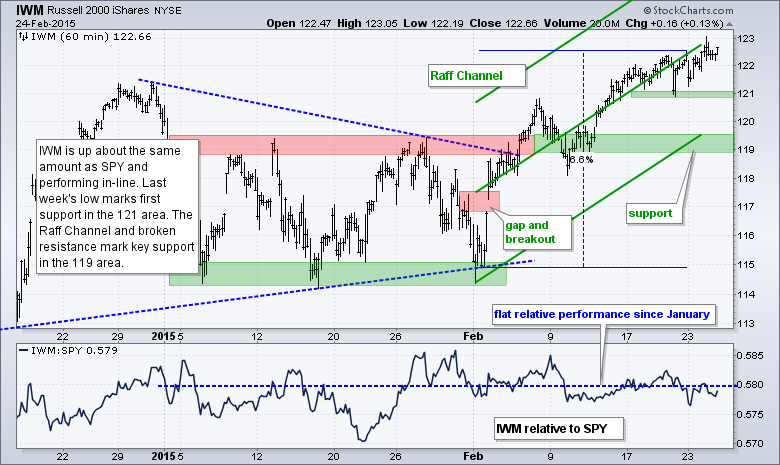
- SPY, QQQ and IWM are in short-term uptrends, but overbought after big moves this month.
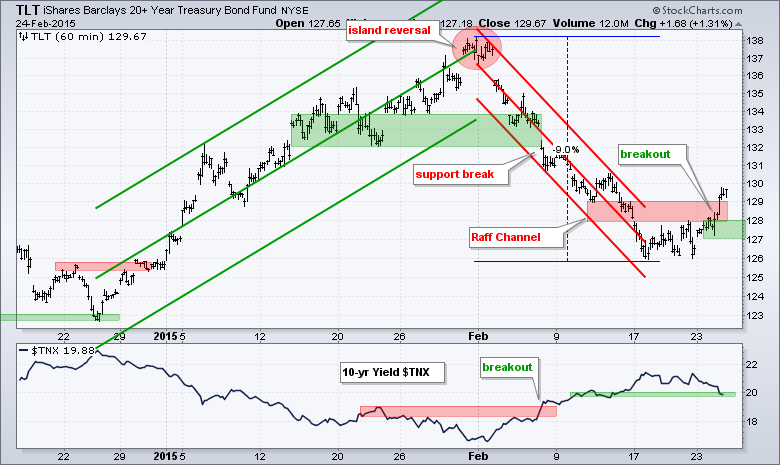
- TLT plunged 9%, became oversold, firmed and broke out with a surge on 24-Feb.
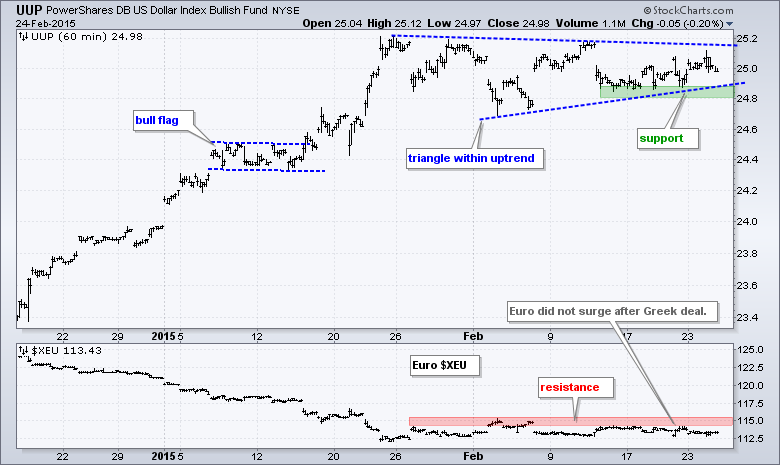
- UUP is firming near the lower trend line of a triangle and within an uptrend overall.
- USO fell back from range resistance and broke a triangle trend line on 23-Feb.
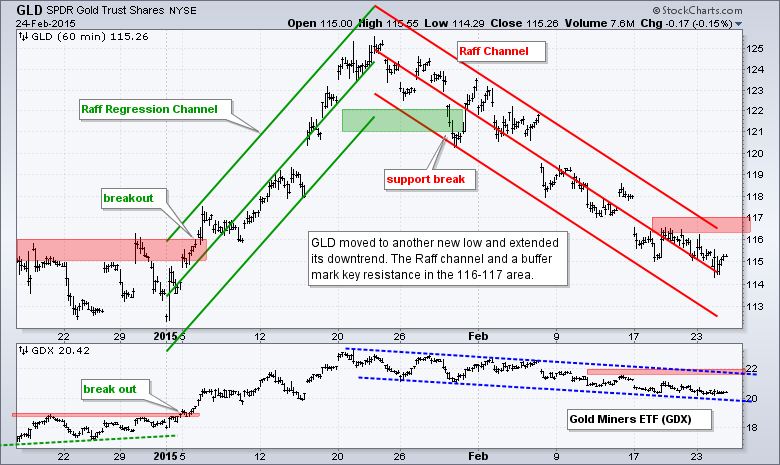
- GLD broke down on 29-Jan and remains in a clear downtrend.
The E-mini continues to edge higher and nothing has really changed from a daily perspective. The triangle breakout remains and the broken resistance zone turns into the first support zone.
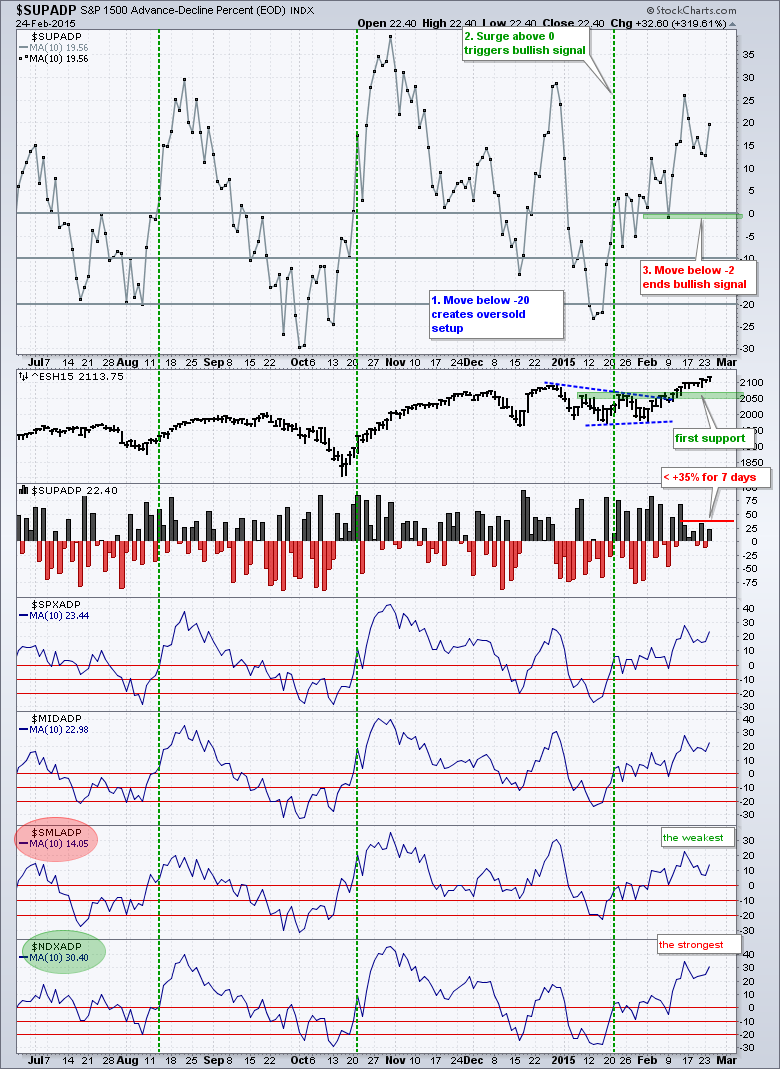
Breadth remains short-term bullish overall, but the daily readings continue to underwhelm. Note that S&P 1500 AD Percent ($SUPADP) has not been above +35% since 12-February. The 10-day SMA for S&P 1500 AD Percent ($SUPADP) is still positive and we have yet to see an increase in selling pressure. The indicator bounced on Tuesday because the average dropped a big negative number and added a small positive number.
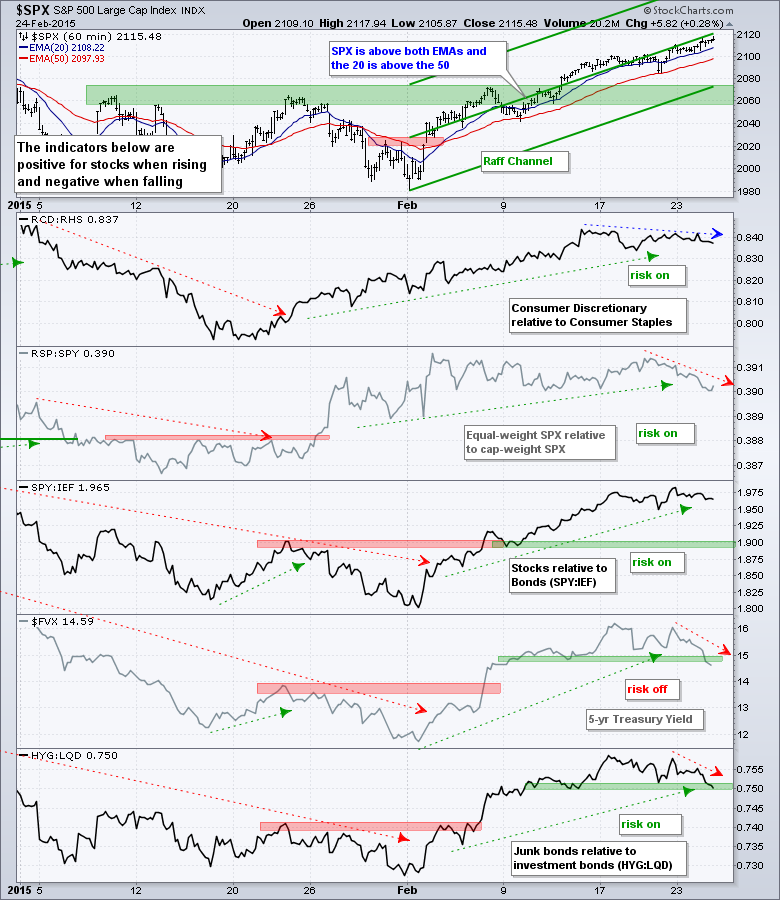
I am seeing some risk aversion creep into the market. The RCD:RHS ratio stalled out and the RSP:SPY ratio edged lower over the past week. These two have not broken down and turned outright negative, but bear watching. The 5-year Treasury Yield ($FVX) fell rather sharply this week and moved below its mid February low. This means money is moving into the short end of the yield curve and I have downgraded this indicator to negative (risk off). Junk bonds have underperformed investment grade bonds the past week and a break down in the HYG:LQD ratio would be negative.
The short-term evidence remains bullish for stocks, but the picture is less bullish than last week. Breadth has been underwhelming the last seven days. Signs of risk aversion are starting to creep into the bond market and oil broke down on Monday. SPY, IWM and QQQ are in uptrends, but short-term overbought and ripe for a pullback or consolidation.
**************************************************************
**************************************************************
**************************************************************
**************************************************************
**************************************************************

**************************************************************
***************************************************************
Key Reports and Events (all times Eastern):
Wed - Feb 25 - 07:00 - MBA Mortgage Index
Wed - Feb 25 - 10:00 - New Home Sales
Wed - Feb 25 - 10:00 - Yellen Testifies before Congress
Wed - Feb 25 - 10:30 - Oil Inventories
Thu - Feb 26 - 08:30 - Initial Jobless Claims
Thu - Feb 26 - 08:30 - Consumer Price Index (CPI)
Thu - Feb 26 - 08:30 - Durable Goods Orders
Thu - Feb 26 - 09:00 - FHFA Housing Price Index
Thu - Feb 26 - 10:30 - Natural Gas Inventories
Fri - Feb 27 - 08:30 - GDP
Fri - Feb 27 - 09:45 - Chicago PMI
Fri - Feb 27 - 09:55 - Michigan Sentiment
Fri - Feb 27 - 10:00 - Pending Home Sales
This commentary is designed to stimulate thinking. This analysis is not a recommendation to buy, sell, hold or sell short any security (stock ETF or otherwise). We all need to think for ourselves when it comes to trading our own accounts. First, it is the only way to really learn. Second, we are the only ones responsible for our decisions. Think of these charts as food for further analysis. Before making a trade, it is important to have a plan. Plan the trade and trade the plan. Among other things, this includes setting a trigger level, a target area and a stop-loss level. It is also important to plan for three possible price movements: advance, decline or sideways. Have a plan for all three scenarios BEFORE making the trade. Consider possible holding times. And finally, look at overall market conditions and sector/industry performance.


