Stocks were pummeled again on Tuesday with large-caps leading the way. Large-caps have more overseas exposure and are more affected by a strong Dollar. Small-caps held up better, but were not immune to selling pressure. All sectors moved lower with the Technology SPDR (XLK) and the Finance SPDR (XLF) falling over 2%. Finance looks especially weak because XLF formed a lower high from late December to early March and broke down on Tuesday. Utilities, Treasuries, MLPs and Biotechs held up relatively well. Yes, biotechs held up relatively well and Biotech SPDR (XBI) finished with a .36% gain. How's that for relative strength.
**This chart analysis is for educational purposes only, and should not
be construed as a recommendation to buy, sell or sell-short said securities**
Webinar Note-Link: Julius de Kempenaer, create of Relative Rotation Graphs, and I did a webinar showing how to use a top-down approach for selecting stocks. We focused on finance (bearish), consumer discretionary (bullish), two strong industry groups and some strong stocks. Click here for the recording.
Short-term Overview (Wednesday, 11-March-2015):
- Breadth turned short-term bearish on March 4th.
- Two of the five risk indicators are negative.
- SPY broke down on March 4th and extended its short-term downtrend.
- QQQ broke down on March 6th and extended its short-term downtrend.
- IWM broke support on March 10th, but shows relative strength.
- TLT got an oversold bounce and is now challenging first resistance.
- UUP broke out of a triangle on 27-Feb and surged the last five days.
- USO remains in a downtrend defined by a falling wedge pattern.
- GLD plunged to new lows again this week and has been in a downtrend since 29-Jan.
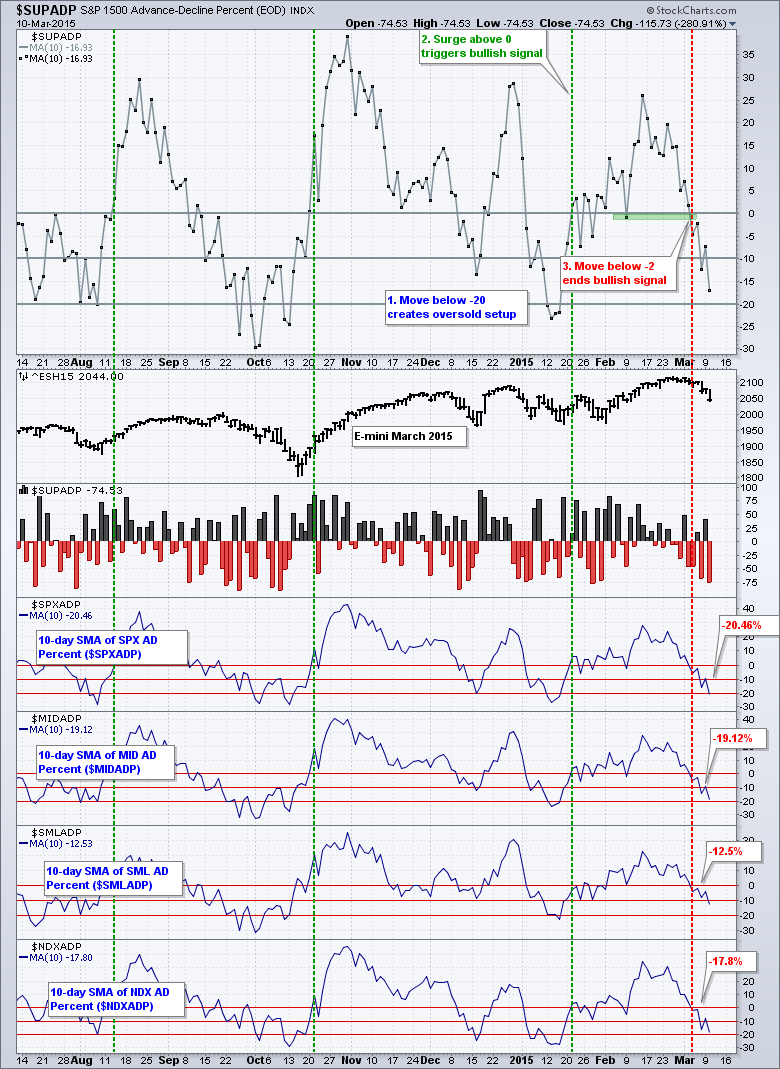
The 10-day SMA of S&P 1500 AD Percent ($SUPADP) moved below -2% to trigger a bearish signal on March 4th. AD Percent moved below -70% on Tuesday with pretty heavy selling pressure. It was not, however, a huge down day like we saw in late September and October when AD Percent moved below -80% a few times. At this point, I am simply waiting for the 10-day SMA to move below -20% to become oversold and activate a potential bullish setup. Note that selling pressure has been concentrated in large-caps because the 10-day SMA for S&P 500 AD Percent ($SPXADP) is below -20% and the 10-day SMA for S&P SmallCap AD Percent ($SMLADP) is at -12.5%.
Two of the five risk indicators are negative. The equal-weight S&P 500 is underperforming the cap-weight S&P 500 and this shows risk aversion within the S&P 500. The SPY:IEF ratio broke below its late February lows and stocks are now underperforming Treasuries (short-term). This also shows risk aversion. On the 60-minute S&P 500 chart, the 20-period EMA moved below the 50-period EMA on March 4th, and the S&P 500 moved below both moving averages that same day.

I am also watching the HYG:LQD ratio because the High-Yield Bond ETF (HYG) could come under pressure if junk bonds fall further. The key is if HYG falls more than the Investment Grade Bond ETF (LQD). A break below the late February lows in the HYQ:LQD ratio would show risk aversion in the corporate bond market.
The short-term evidence favors the bears. Even though I think this is a correction within a bigger uptrend, there is no telling how long stocks will trend lower. The short-term downtrends will end when the evidence turns bullish. It could be a few more days or a few more weeks.

**************************************************************

**************************************************************

**************************************************************

**************************************************************

**************************************************************

**************************************************************

***************************************************************
Key Reports and Events (all times Eastern):
Wed - Mar 11 - 07:00 - MBA Mortgage Index
Wed - Mar 11 - 10:30 - Crude Oil Inventories
Thu - Mar 12 - 08:30 - Initial Jobless Claims
Thu - Mar 12 - 08:30 - Retail Sales
Thu - Mar 12 - 10:00 - Business Inventories
Thu - Mar 12 - 10:30 - Natural Gas Inventories
Fri - Mar 13 - 08:30 - Producer Price Index (PPI)
Fri - Mar 13 - 10:00 - Michigan Sentiment
Mon - Mar 16 - 08:30 - Empire State Manufacturing
Mon - Mar 16 - 09:15 - Industrial Production
Mon - Mar 16 - 10:00 - NAHB Housing Market Index
Tue - Mar 17 - 08:30 - Building Permits-Housing Starts
Wed - Mar 18 - 07:00 - MBA Mortgage Index
Wed - Mar 18 - 10:30 - Crude Oil Inventories
Wed - Mar 18 - 14:00 - FOMC Rate Decision
Thu - Mar 19 - 08:30 - Initial Jobless Claims
Thu - Mar 19 - 10:00 - Philadelphia Fed
Thu - Mar 19 - 10:00 - Leading Economic Indicators
Thu - Mar 19 - 10:30 - Natural Gas Inventories
Mon - Mar 23 - 10:00 - Existing Home Sales
Tue - Mar 24 - 08:30 - Consumer Price Index (CPI)
Tue - Mar 24 - 09:00 - FHFA Housing Price Index
Tue - Mar 24 - 10:00 - New Home Sales
Wed - Mar 25 - 07:00 - MBA Mortgage Index
Wed - Mar 25 - 08:30 - Durable Orders
Wed - Mar 25 - 10:30 - Crude Oil Inventories
Thu - Mar 26 - 08:30 - Initial Jobless Claims
Thu - Mar 26 - 10:30 - Natural Gas Inventories
Fri - Mar 27 - 08:30 - GDP
Fri - Mar 27 - 10:00 - Michigan Sentiment
This commentary is designed to stimulate thinking. This analysis is not a recommendation to buy, sell, hold or sell short any security (stock ETF or otherwise). We all need to think for ourselves when it comes to trading our own accounts. First, it is the only way to really learn. Second, we are the only ones responsible for our decisions. Think of these charts as food for further analysis. Before making a trade, it is important to have a plan. Plan the trade and trade the plan. Among other things, this includes setting a trigger level, a target area and a stop-loss level. It is also important to plan for three possible price movements: advance, decline or sideways. Have a plan for all three scenarios BEFORE making the trade. Consider possible holding times. And finally, look at overall market conditions and sector/industry performance.


