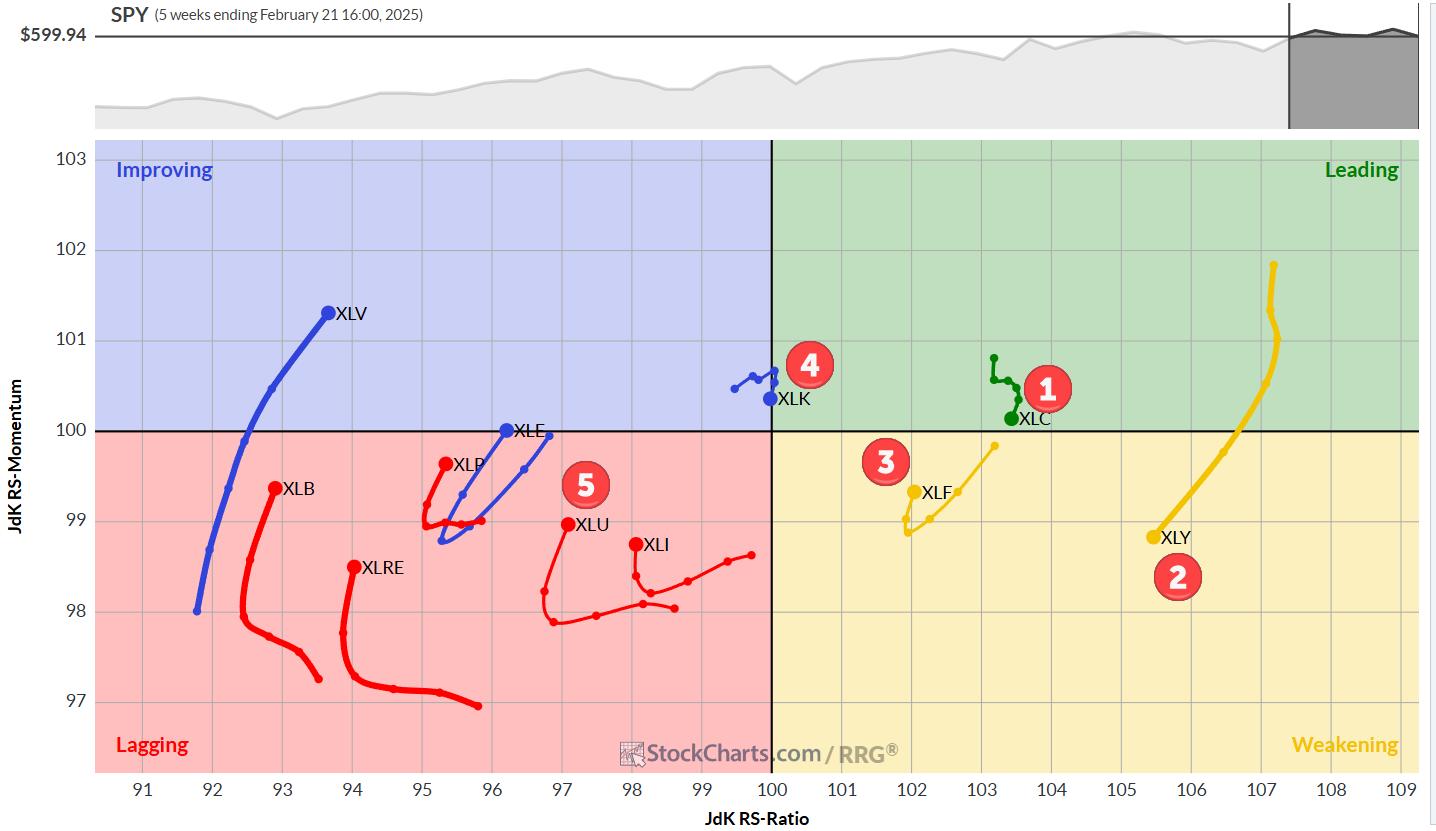
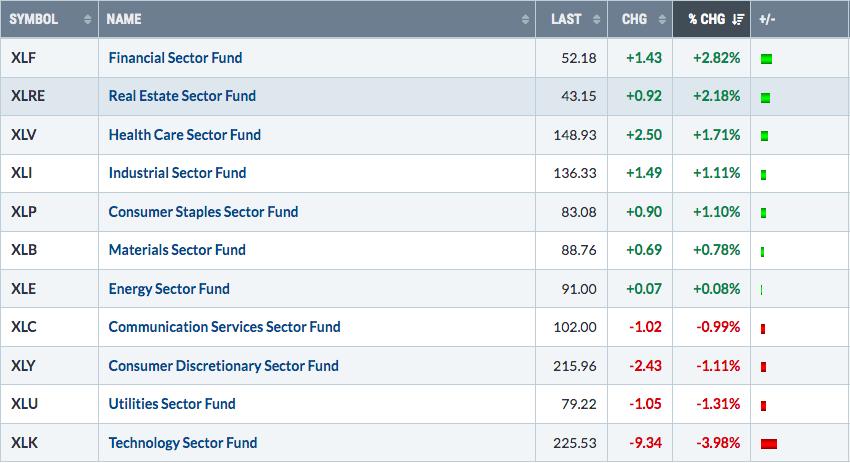
Trading was very mixed on Wall Street. Large-caps were under selling pressure as the Dollar surged to new highs yet again. SPY lost .23% on the day and the US Dollar ETF (UUP) surged 1.11%. Small-caps attracted some buying interest because they are largely immune to Dollar strength. The large-cap losers this month include Procter & Gamble (PG), Mondelez (MDLZ), Pepsico (PEP), Colgate Palmolive (CL) and Coca-Cola (KO). These big multi-nationals are also the leaders in the Consumer Staples SPDR (XLP), which is down over 4% this month and lagging since mid January. Financials and healthcare led the small-cap sectors.
**This chart analysis is for educational purposes only, and should not
be construed as a recommendation to buy, sell or sell-short said securities**
Short-term Overview (Thursday, 12-March-2015):
- Breadth turned short-term bearish on March 4th.
- Two of the five risk indicators remain negative.
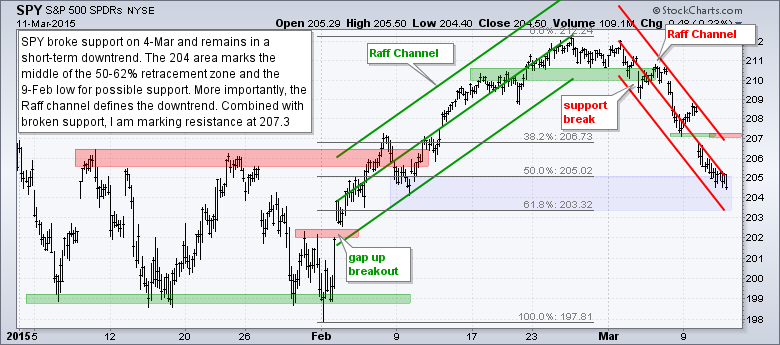
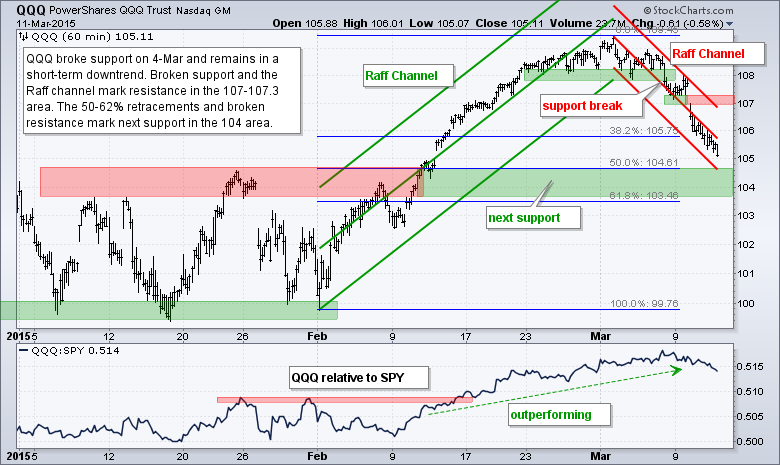
- SPY broke down on March 4th and QQQ broke down on March 6th.
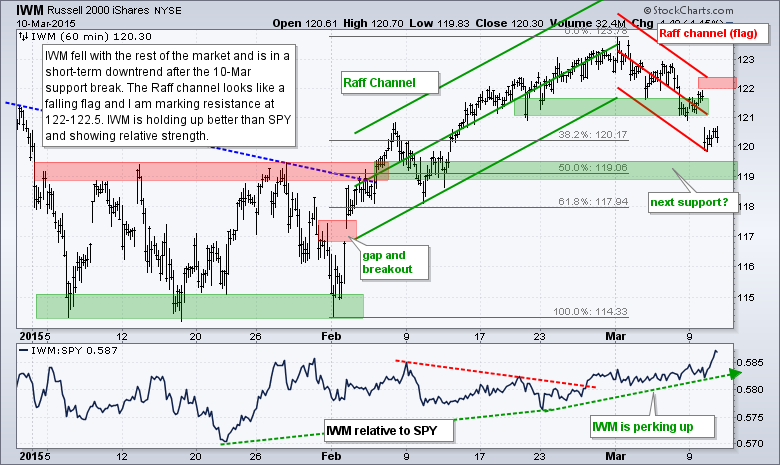
- IWM broke support on March 10th, but shows relative strength.
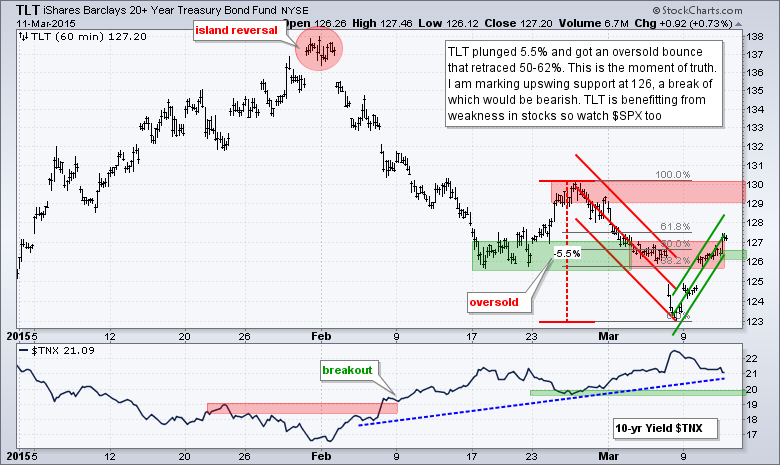
- TLT got an oversold bounce to a key retracement zone.
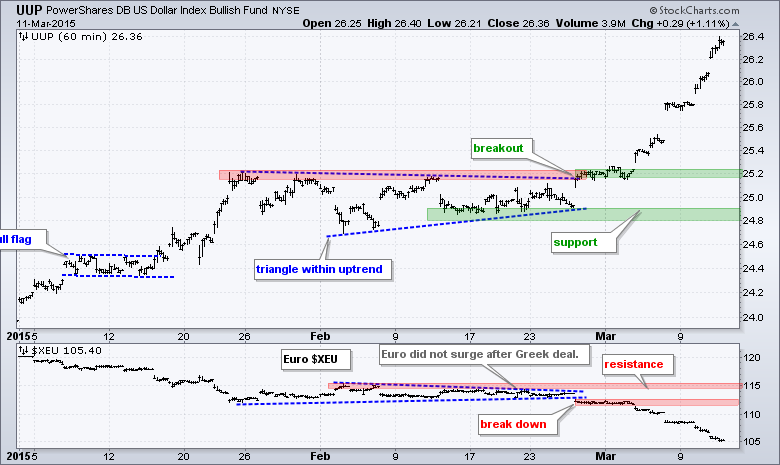
- UUP broke out of a triangle on 27-Feb and surged the last six days.
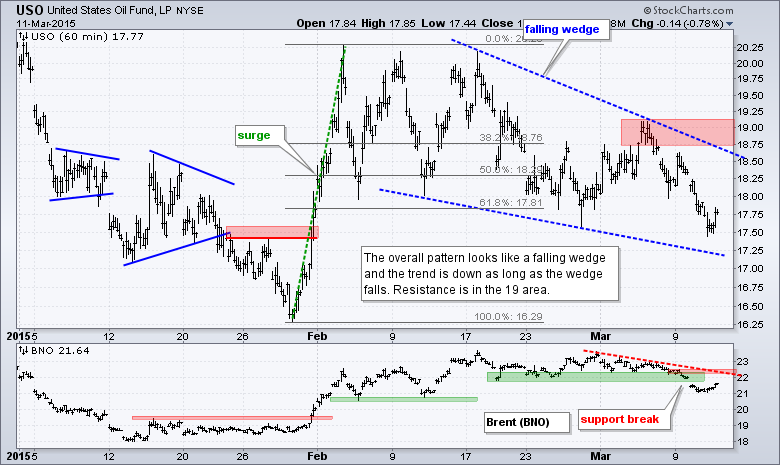
- USO remains in a downtrend defined by a falling wedge pattern.
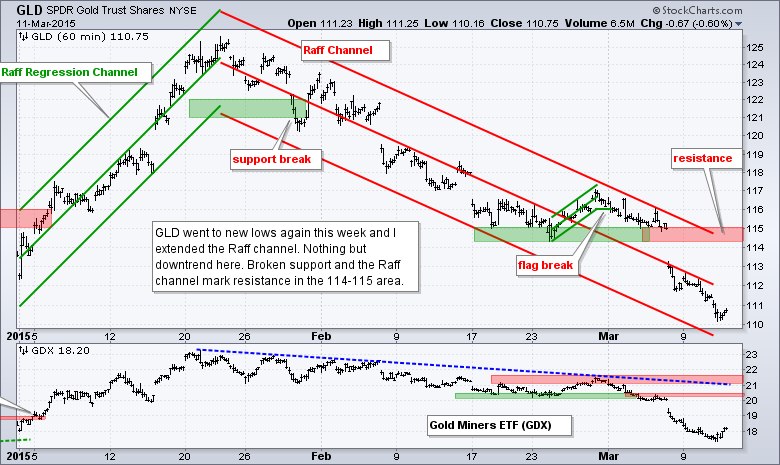
- GLD plunged to new lows again this week and has been in a downtrend since 29-Jan.
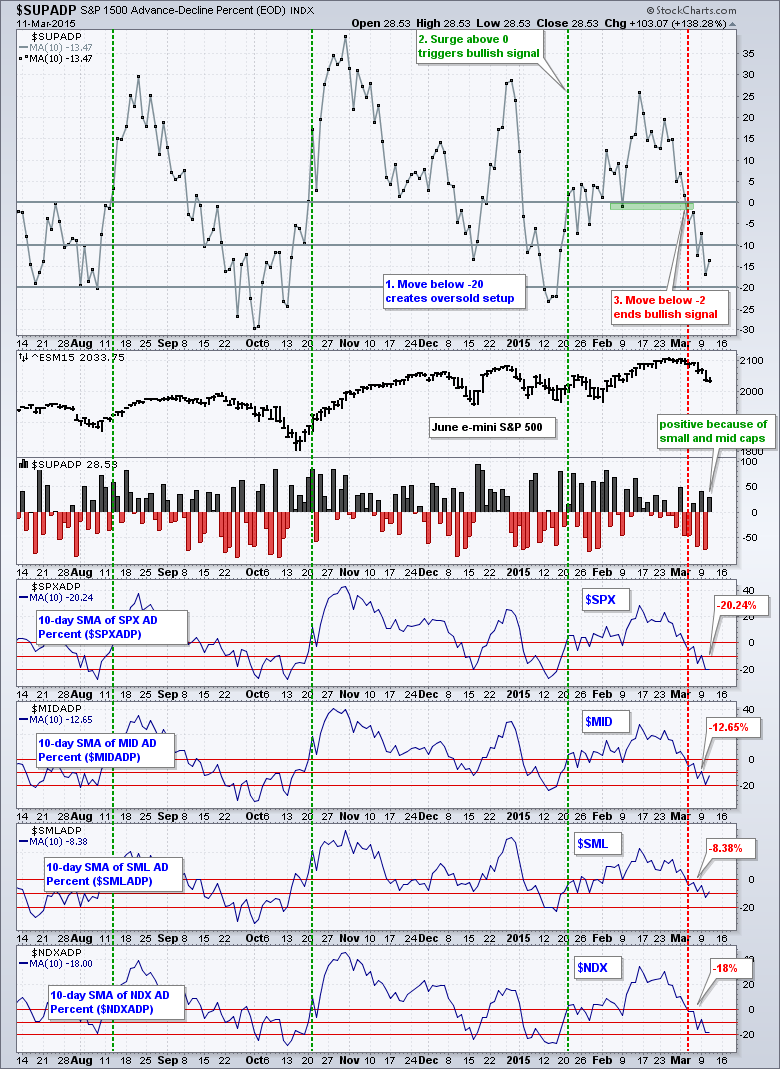
The 10-day SMA of S&P 1500 AD Percent ($SUPADP) moved below -2% to trigger a bearish signal on March 4th. The AD Percent indicators were mixed on Wednesday. S&P SmallCap AD Percent ($SMLADP) and S&P MidCap AD Percent ($MIDADP) finished positive, but S&P 500 AD Percent ($SPXADP) and Nasdaq 100 AD Percent ($NDXADP) finished negative. There are 600 small-caps, 400 mid-caps and 500 larger-caps in the S&P 1500. Small and mid caps clearly hold the advantage and S&P 1500 AD Percent ($SUPADP) finished positive as a result. Also notice that the 10-day SMA for S&P SmallCap AD Percent is the least weak of the four (relative strength). This suggests that small-caps will lead once the correction is over for the broader market. But it ain't over yet.
Two of the five risk indicators are negative. The equal-weight S&P 500 has been underperforming the cap-weight S&P 500 since 19-Feb, but the RSP:SPY ratio turned up the last few days. This is because of relative weakness in large-caps, which dominate SPY. A break above the early March high would turn this risk indicator positive. Elsewhere, the consumer discretionary sector is outperforming the consumer staples sector.
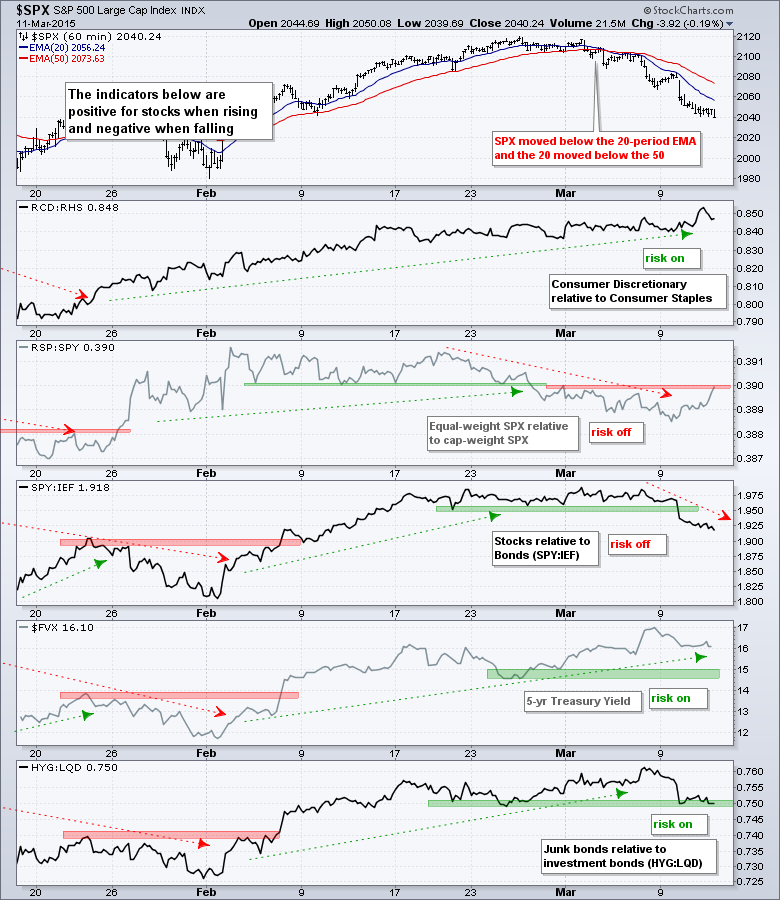
The bond-related indicators are mixed. Stocks are underperforming bonds (negative) and the 5-year Treasury Yield ($FVX) is rising (positive). I am still watching the HYG:LQD ratio because the High-Yield Bond ETF (HYG) could come under pressure if oil continues lower. Relative weakness in HYG would signal risk aversion in the corporate bond market.
No change. The short-term evidence favors the bears. Even though I think this is a correction within a bigger uptrend, there is no telling how long stocks will trend lower. The short-term downtrends will end when the evidence turns bullish. It could be a few more days or a few more weeks.
**************************************************************
**************************************************************
**************************************************************
**************************************************************
**************************************************************
**************************************************************
***************************************************************
Key Reports and Events (all times Eastern):
Thu - Mar 12 - 08:30 - Initial Jobless Claims
Thu - Mar 12 - 08:30 - Retail Sales
Thu - Mar 12 - 10:00 - Business Inventories
Thu - Mar 12 - 10:30 - Natural Gas Inventories
Fri - Mar 13 - 08:30 - Producer Price Index (PPI)
Fri - Mar 13 - 10:00 - Michigan Sentiment
Mon - Mar 16 - 08:30 - Empire State Manufacturing
Mon - Mar 16 - 09:15 - Industrial Production
Mon - Mar 16 - 10:00 - NAHB Housing Market Index
Tue - Mar 17 - 08:30 - Building Permits-Housing Starts
Wed - Mar 18 - 07:00 - MBA Mortgage Index
Wed - Mar 18 - 10:30 - Crude Oil Inventories
Wed - Mar 18 - 14:00 - FOMC Rate Decision
Thu - Mar 19 - 08:30 - Initial Jobless Claims
Thu - Mar 19 - 10:00 - Philadelphia Fed
Thu - Mar 19 - 10:00 - Leading Economic Indicators
Thu - Mar 19 - 10:30 - Natural Gas Inventories
Mon - Mar 23 - 10:00 - Existing Home Sales
Tue - Mar 24 - 08:30 - Consumer Price Index (CPI)
Tue - Mar 24 - 09:00 - FHFA Housing Price Index
Tue - Mar 24 - 10:00 - New Home Sales
Wed - Mar 25 - 07:00 - MBA Mortgage Index
Wed - Mar 25 - 08:30 - Durable Orders
Wed - Mar 25 - 10:30 - Crude Oil Inventories
Thu - Mar 26 - 08:30 - Initial Jobless Claims
Thu - Mar 26 - 10:30 - Natural Gas Inventories
Fri - Mar 27 - 08:30 - GDP
Fri - Mar 27 - 10:00 - Michigan Sentiment
This commentary is designed to stimulate thinking. This analysis is not a recommendation to buy, sell, hold or sell short any security (stock ETF or otherwise). We all need to think for ourselves when it comes to trading our own accounts. First, it is the only way to really learn. Second, we are the only ones responsible for our decisions. Think of these charts as food for further analysis. Before making a trade, it is important to have a plan. Plan the trade and trade the plan. Among other things, this includes setting a trigger level, a target area and a stop-loss level. It is also important to plan for three possible price movements: advance, decline or sideways. Have a plan for all three scenarios BEFORE making the trade. Consider possible holding times. And finally, look at overall market conditions and sector/industry performance.