Stocks were mixed on Thursday. QQQ and IWM closed fractionally higher, but SPY and DIA edged lower. Finance weighed on the market as the Finance SPDR (XLF) lost .93%. The Materials SPDR (XLB) and Energy SPDR (XLE) were also weak with declines greater than 1.5%. Pretty much anything oil-related came under selling pressure as crude fell 4%. Note that crude is trading near its late January lows and hit a fresh 52-week low earlier this week. While an oversold bounce may still be in the cards, the big trend is down and I am deferring to the greater force. Elsewhere, you will never guess which industry group ETF hit a new high on Thursday. Time's up. It was the Biotech SPDR (XBI) with another 2.75% gain. It may be a melt up, but it is definitely an uptrend.
**This chart analysis is for educational purposes only, and should not
be construed as a recommendation to buy, sell or sell-short said securities**
Short-term Overview (Friday, 20-March-2015):
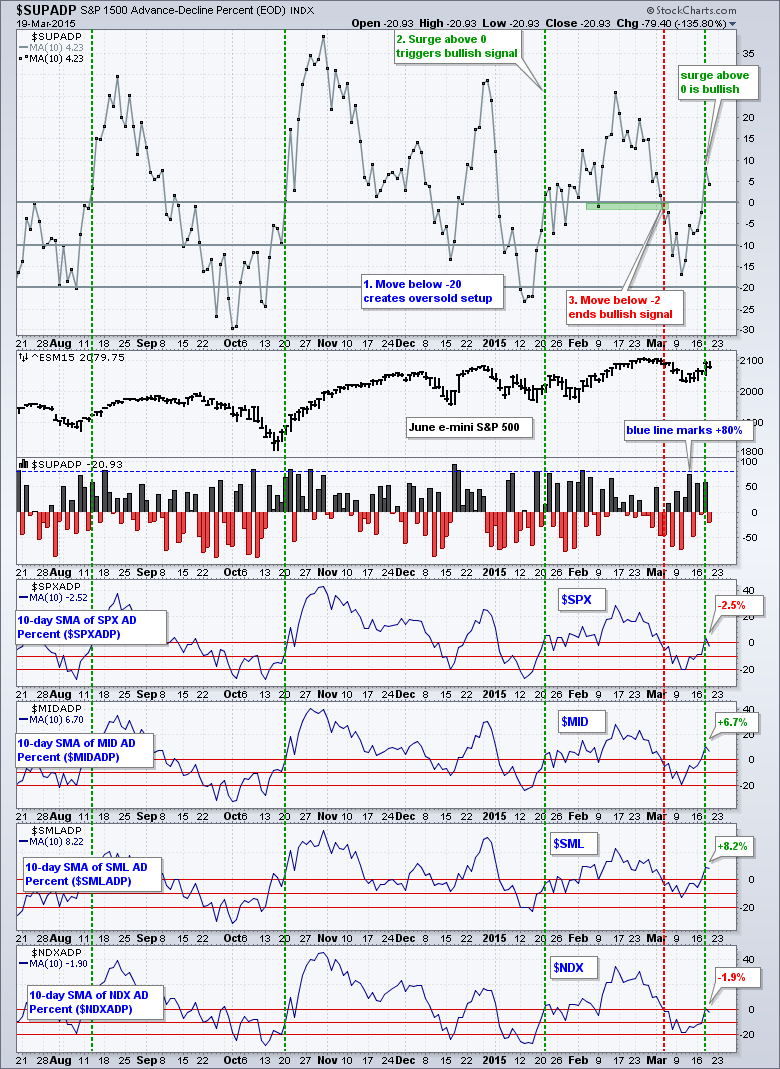
- Breadth turned bullish as the 10-day SMA for AD Percent moved above zero on March 18th.
- The two stock-related risk indicators are positive, but the three bond-related indicators are negative.
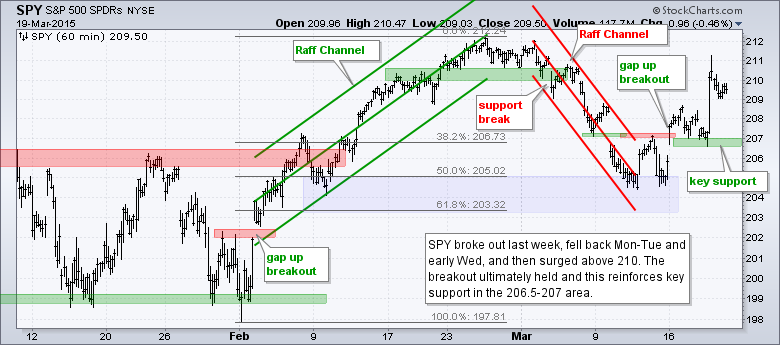
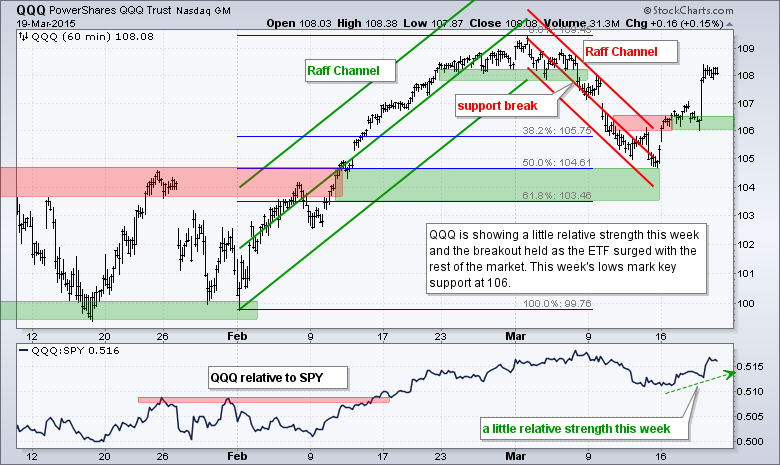
- SPY and QQQ held their breakouts and surged on Wednesday (uptrends since March 16th).
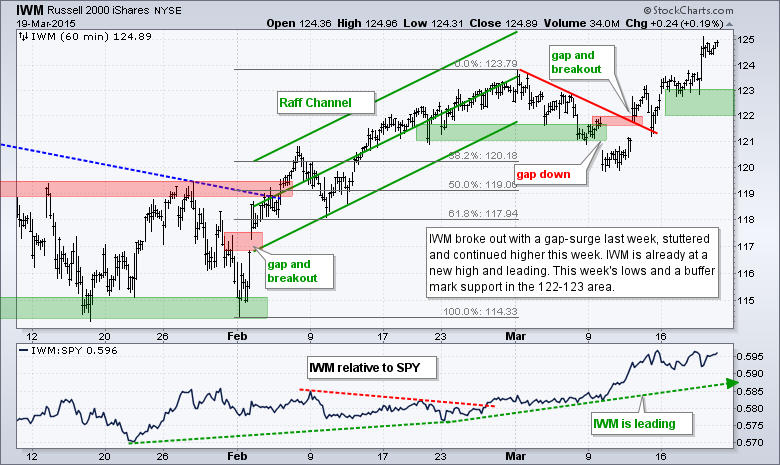
- IWM surged to a new high and shows relative strength overall (uptrend since March 12th).
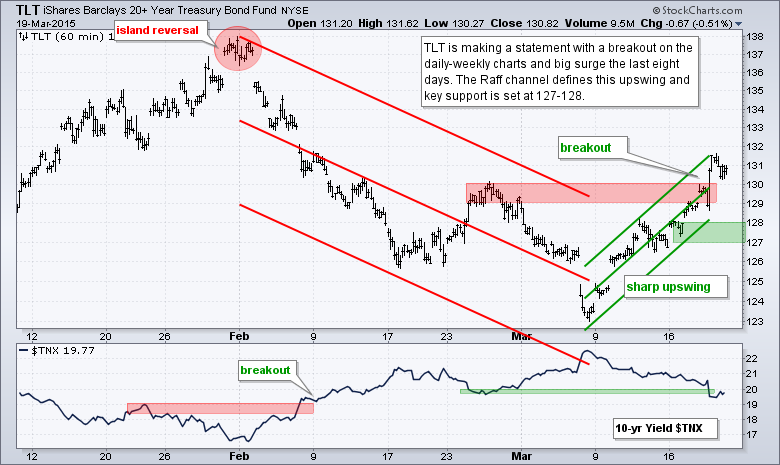
- TLT broke out with a big surge after the Fed announcement.
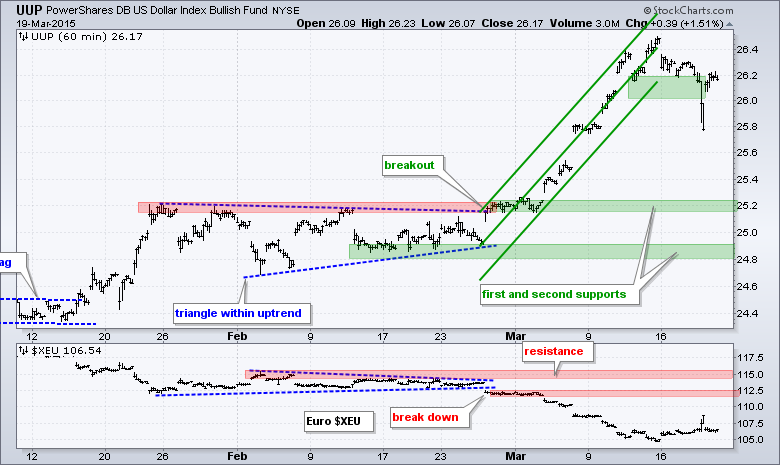
- UUP rebounded and the big trend remains up (breakout on 27-Feb).
- USO fell back after Wednesday's surge and remains in a downtrend.
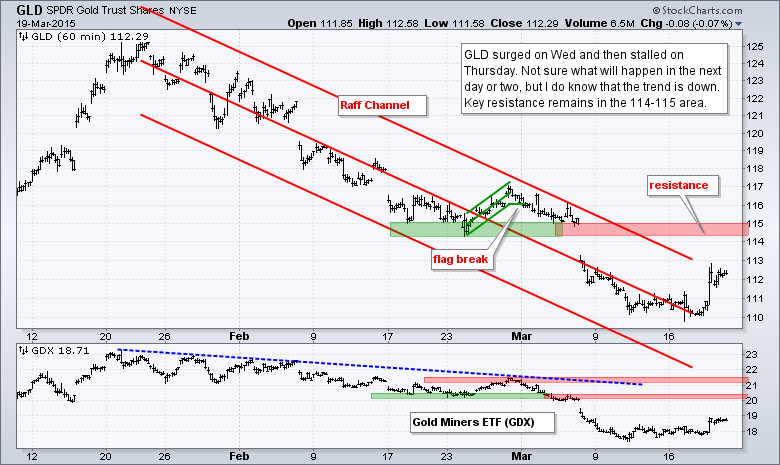
- GLD got a bounce, but is not even close to first resistance (downtrend since 29-Jan).
Breadth indicators were mixed on Thursday. AD Percent finished negative for the S&P 500, S&P MidCap 400 and Nasdaq 100, but slightly positive for the S&P Small-Cap 600. Overall, S&P 1500 AD Percent ($SUPADP) finished at -20%, which shows modest selling pressure. The 10-day SMA remains in positive territory and bullish overall. I am a bit concerned because the advance over the last six days did not feature a breadth thrust above +80%. Buying pressure, while outpacing selling pressure, appears a bit tepid.
No change. The risk indicators are mixed (2 positive and 3 negative). The two stock-specific indicators are positive because consumer discretionary is outperforming consumer staples and the Equal-Weight S&P 500 ETF (RSP) is outperforming the S&P 500 SPDR (SPY). Consumer discretionary is the most economically sensitive sector and relative strength bodes well for stocks overall.
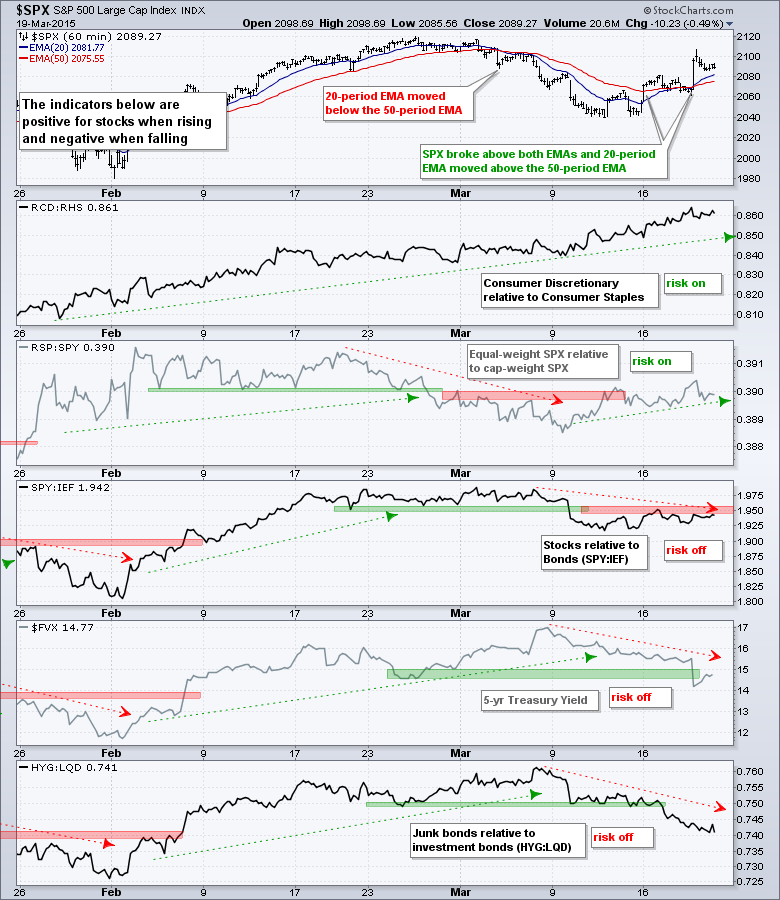
No change. The three bond-related indicators are negative. Stocks have been underperforming bonds as the SPY:IEF ratio broke down last week. The 5-year Treasury Yield ($FVX) broke down on Wednesday and this means money is moving into the short end of the yield curve. The HYG:LQD ratio broke down this week and this points to risk aversion in the bond market (junk underperforming investment grade). While I am concerned about these developments, the stock-related indicators carry more weight because they have closer ties to the stock market. The consumer discretionary sector and the Equal-Weight S&P 500 ETF are part of the stock market. Bonds are not.
The evidence favors the bulls, but there are some bearish indicators hanging around. First and foremost, SPY, QQQ and IWM broke out and these breakouts are holding. IWM is leading and QQQ is starting to show some leadership. Concern comes in because breadth was not that impressive the last six days and three of the five risk indicators are negative. These three indicators are bond related though. For now, I will put more weight on the breakouts in the major index ETFs and relative strength in small-caps.
**************************************************************
**************************************************************
**************************************************************
**************************************************************
**************************************************************

**************************************************************
***************************************************************
Key Reports and Events (all times Eastern):
Mon - Mar 23 - 10:00 - Existing Home Sales
Tue - Mar 24 - 08:30 - Consumer Price Index (CPI)
Tue - Mar 24 - 09:00 - FHFA Housing Price Index
Tue - Mar 24 - 10:00 - New Home Sales
Wed - Mar 25 - 07:00 - MBA Mortgage Index
Wed - Mar 25 - 08:30 - Durable Orders
Wed - Mar 25 - 10:30 - Crude Oil Inventories
Thu - Mar 26 - 08:30 - Initial Jobless Claims
Thu - Mar 26 - 10:30 - Natural Gas Inventories
Fri - Mar 27 - 08:30 - GDP
Fri - Mar 27 - 10:00 - Michigan Sentiment
This commentary is designed to stimulate thinking. This analysis is not a recommendation to buy, sell, hold or sell short any security (stock ETF or otherwise). We all need to think for ourselves when it comes to trading our own accounts. First, it is the only way to really learn. Second, we are the only ones responsible for our decisions. Think of these charts as food for further analysis. Before making a trade, it is important to have a plan. Plan the trade and trade the plan. Among other things, this includes setting a trigger level, a target area and a stop-loss level. It is also important to plan for three possible price movements: advance, decline or sideways. Have a plan for all three scenarios BEFORE making the trade. Consider possible holding times. And finally, look at overall market conditions and sector/industry performance.


