Is it volatile enough for ya? The S&P 500 fell to the 2062 area in the early afternoon (down around 14 points) and then shot higher with a move above 2105. The move from low to high was around 45 points and the index closed up 1.22% (25.22 points). It is a nice gain for sure, but not really a huge surge. 2+ percent would be a huge surge. All sectors were higher, but the gains were lopsided. The Utilities SPDR (XLU) and Energy SPDR (XLE) led with 2+ percent surges. The Consumer Discretionary SPDR (XLY) and Finance SPDR (XLF) lagged with gains that were less than 1%. The Home Construction iShares (ITB) showed some upside leadership with a 1.83% gain.
**This chart analysis is for educational purposes only, and should not
be construed as a recommendation to buy, sell or sell-short said securities**
Short-term Overview (Thursday, 19-March-2015):
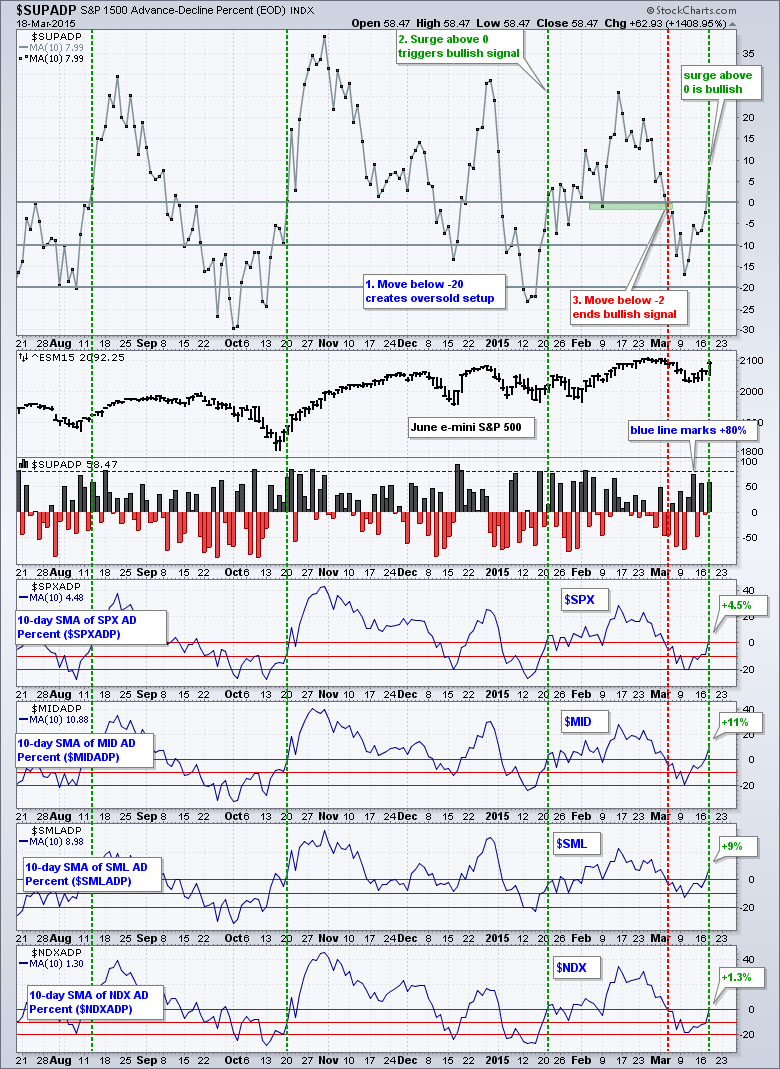
- Breadth turned bullish as the 10-day SMA for AD Percent moved above zero on March 18th.
- The two stock-related risk indicators are positive, but the three bond-related indicators are negative.
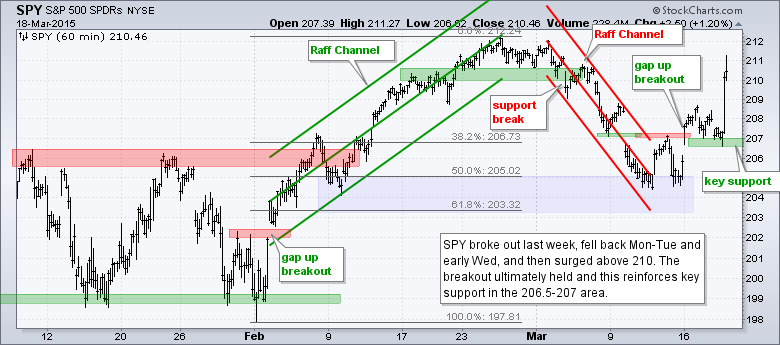
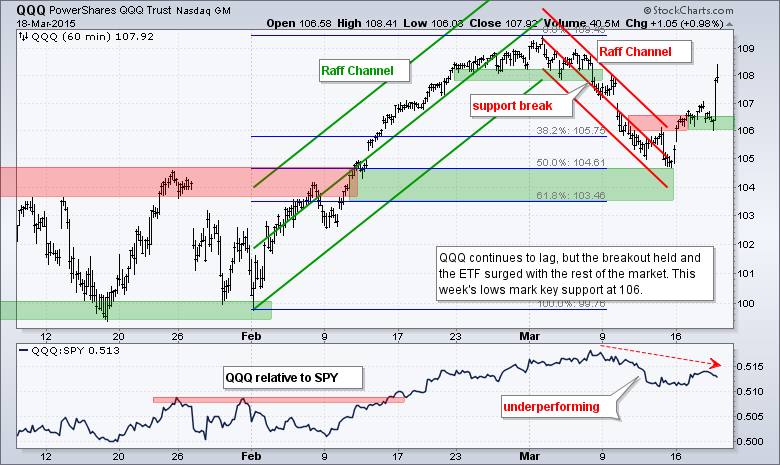
- SPY and QQQ held their breakouts and surged on Wednesday (uptrends since March 16th).
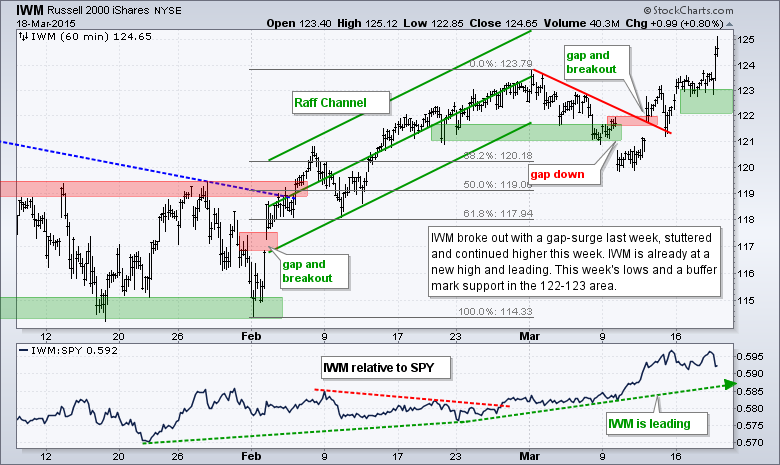
- IWM surged to a new high and shows relative strength overall (uptrend since March 12th).
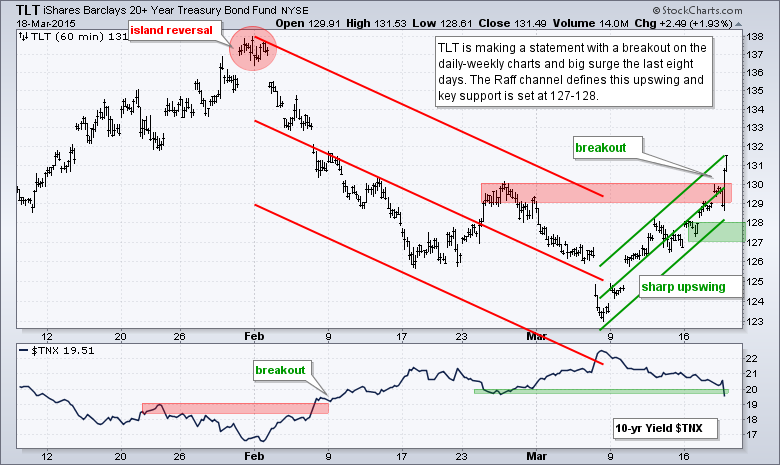
- TLT broke out with a big surge after the Fed announcement.
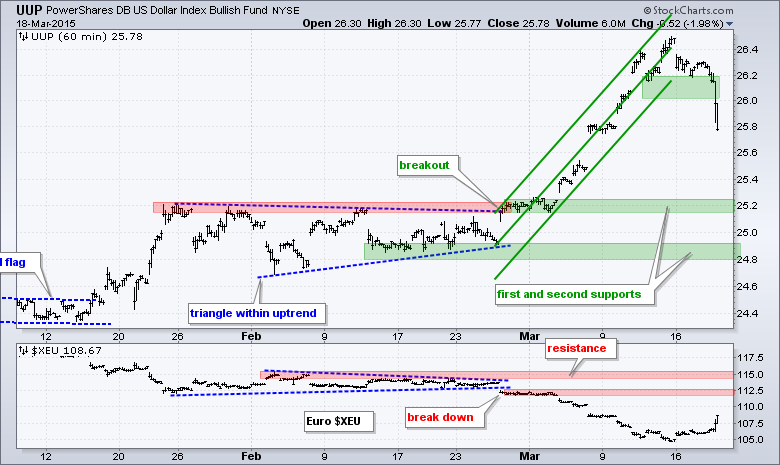
- UUP fell back with a sharp decline, but the bigger trend remains up.
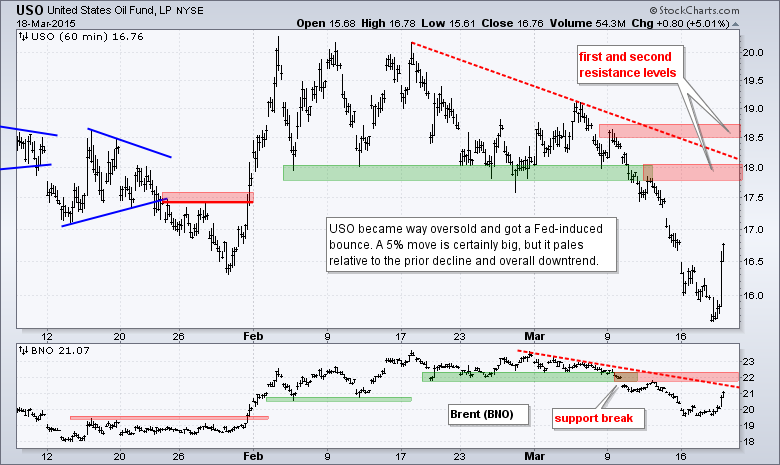
- USO surged with a 5% gain, but the bigger trend remains down.
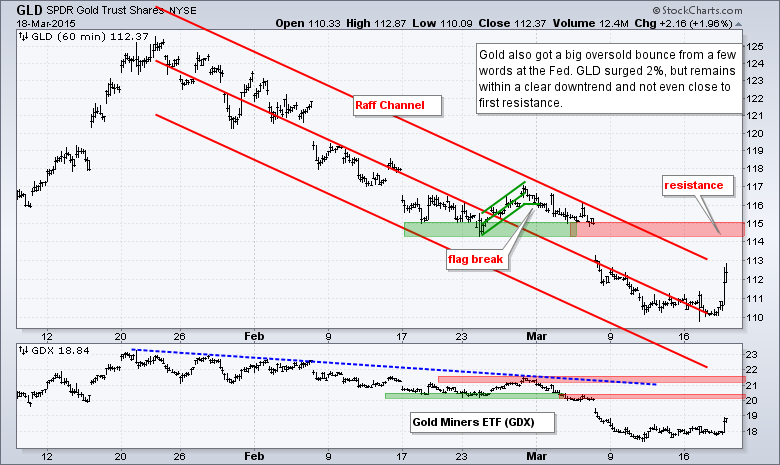
- GLD surged 2%, but is not even close to first resistance (downtrend since 29-Jan).
The 10-day SMA for S&P 1500 AD Percent ($SUPADP) surged above +5% to turn short-term breadth bullish on March 18th. Despite this big move, I was not that impressed with the daily breadth stats. Namely, S&P MidCap AD Percent ($MIDADP) finished at +55% and S&P SmallCap AD Percent ($SMLADP) did not exceed +50% (44.83%). Overall, S&P 1500 AD Percent hit 58.5%, which is above average, but not indicative of an upward breadth thrust.
The risk indicators are mixed. The two stock-specific indicators are positive because consumer discretionary is outperforming consumer staples and the Equal-Weight S&P 500 ETF (RSP) is outperforming the S&P 500 SPDR (SPY). Consumer discretionary is the most economically sensitive sector and relative strength bodes well for stocks overall.
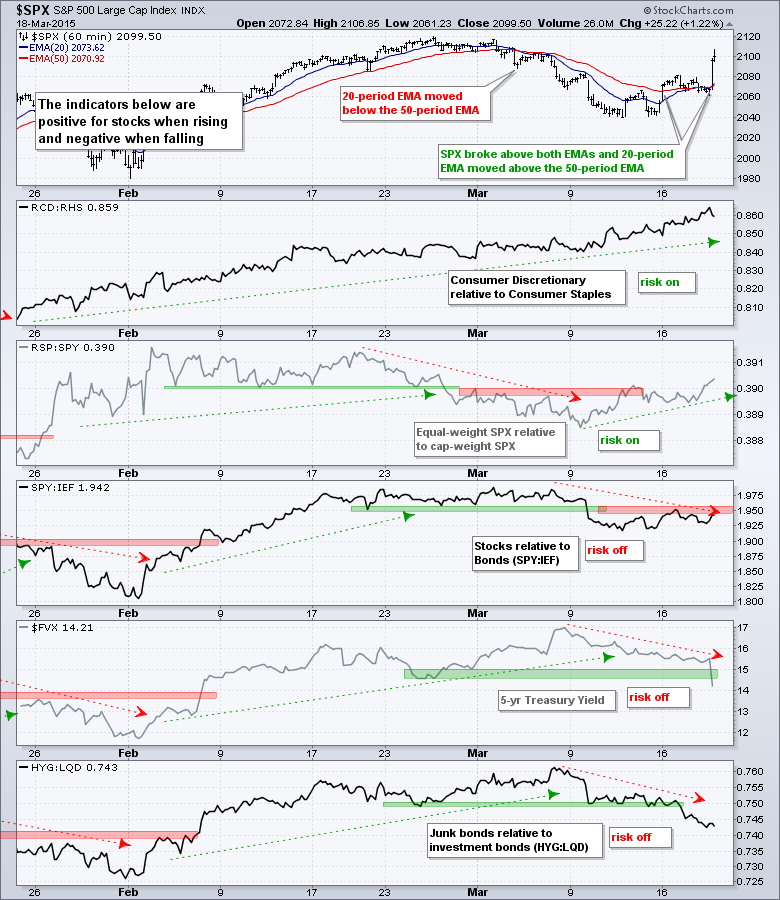
The three bond-related indicators are negative. Stocks have been underperforming bonds as the SPY:IEF ratio broke down last week. The 5-year Treasury Yield ($FVX) broke down on Wednesday and this means money is moving into the short end of the yield curve. The HYG:LQD ratio broke down this week and this points to risk aversion in the bond market (junk underperforming investment grade). While I am concerned about these developments, the stock-related indicators carry more weight because they have closer ties to the stock market. The consumer discretionary sector and the Equal-Weight S&P 500 ETF are part of the stock market. Bonds are not.
The evidence favors the bulls and supports a short-term uptrend in stocks. IWM started it all off with a breakout on March 12th. QQQ and SPY followed with breakouts on March 16th. Breadth finally caught up and turned bullish with a move into positive territory on March 18th. There are some concerns though. Daily readings for AD Percent have not been that inspiring and the bond market shows risk aversion. The breakouts in SPY, QQQ and IWM are holding for now though, and we have a buffer built in after Wednesday's surge. I will defer to pure price action and stay short-term bullish until proven otherwise.
**************************************************************
**************************************************************
**************************************************************
**************************************************************
**************************************************************
**************************************************************
***************************************************************
Key Reports and Events (all times Eastern):
Thu - Mar 19 - 08:30 - Initial Jobless Claims
Thu - Mar 19 - 10:00 - Philadelphia Fed
Thu - Mar 19 - 10:00 - Leading Economic Indicators
Thu - Mar 19 - 10:30 - Natural Gas Inventories
Mon - Mar 23 - 10:00 - Existing Home Sales
Tue - Mar 24 - 08:30 - Consumer Price Index (CPI)
Tue - Mar 24 - 09:00 - FHFA Housing Price Index
Tue - Mar 24 - 10:00 - New Home Sales
Wed - Mar 25 - 07:00 - MBA Mortgage Index
Wed - Mar 25 - 08:30 - Durable Orders
Wed - Mar 25 - 10:30 - Crude Oil Inventories
Thu - Mar 26 - 08:30 - Initial Jobless Claims
Thu - Mar 26 - 10:30 - Natural Gas Inventories
Fri - Mar 27 - 08:30 - GDP
Fri - Mar 27 - 10:00 - Michigan Sentiment
This commentary is designed to stimulate thinking. This analysis is not a recommendation to buy, sell, hold or sell short any security (stock ETF or otherwise). We all need to think for ourselves when it comes to trading our own accounts. First, it is the only way to really learn. Second, we are the only ones responsible for our decisions. Think of these charts as food for further analysis. Before making a trade, it is important to have a plan. Plan the trade and trade the plan. Among other things, this includes setting a trigger level, a target area and a stop-loss level. It is also important to plan for three possible price movements: advance, decline or sideways. Have a plan for all three scenarios BEFORE making the trade. Consider possible holding times. And finally, look at overall market conditions and sector/industry performance.


