Stocks traded flat most of the day on Monday and then got hit with some selling pressure in the final ten minutes and the major index ETFs closed slightly lower. The sectors were mixed with some modest selling pressure hitting the Industrials SPDR (XLI) and the Finance SPDR (XLF). The Consumer Discretionary SPDR (XLY) and Consumer Staples SPDR (XLP) finished with small gains and showed some relative strength. The big moves came from the metals as the Aluminum ETN (JJU) gained 2%, the Copper ETN (JJC) surged 5% and the Base Metals ETF (DBB) gained over 3%. These gains propelled the Metals & Mining SPDR (XME) to a 1.8% gain on the day. The ETF, however, remains in a downtrend overall, as do most metals. There is no real change in the charts today as the current short-term trends extended on Monday.
**This chart analysis is for educational purposes only, and should not
be construed as a recommendation to buy, sell or sell-short said securities**
Short-term Overview (Tuesday, 24-March-2015):
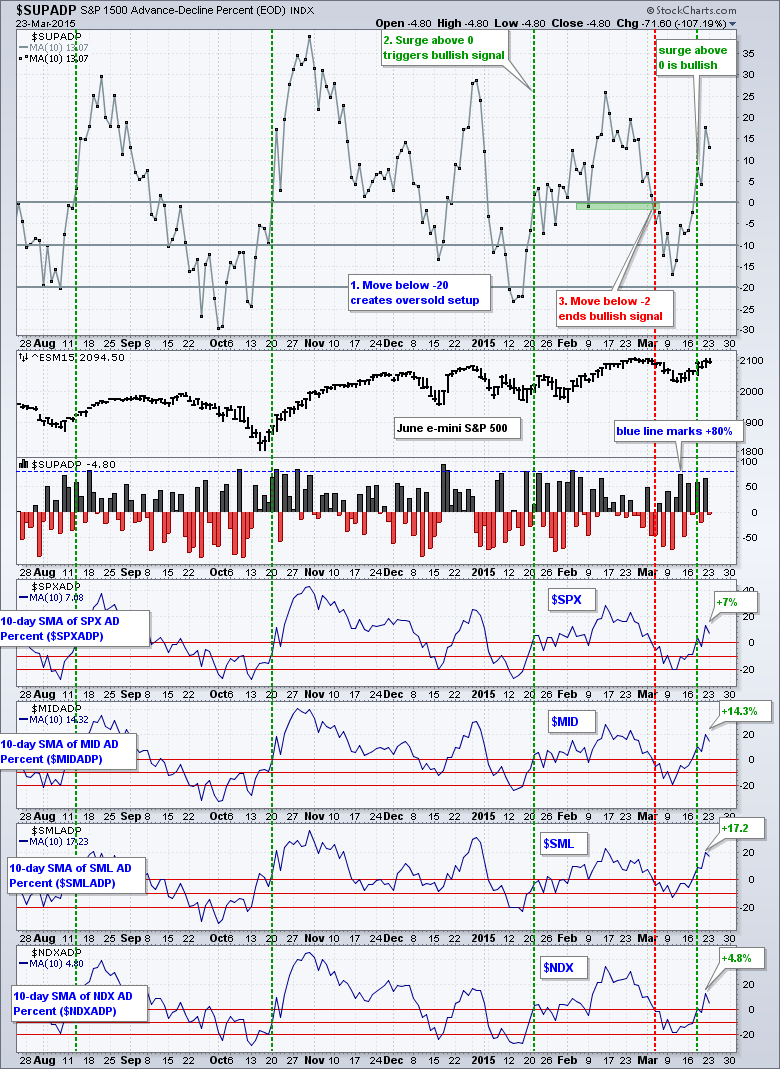
- Breadth turned bullish when the 10-day SMA for AD Percent moved above zero on March 18th.
- The two stock-related risk indicators are positive, but the three bond-related indicators are negative.
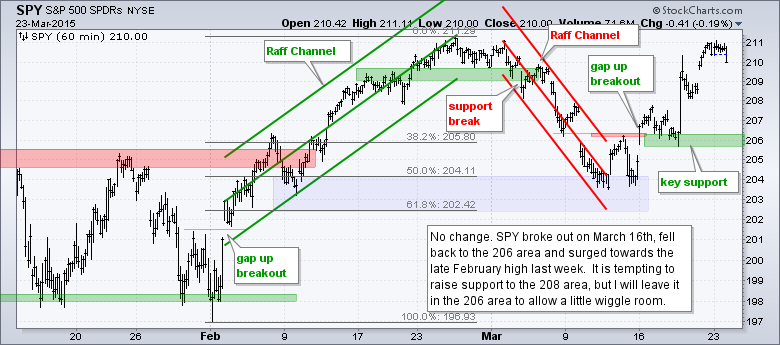
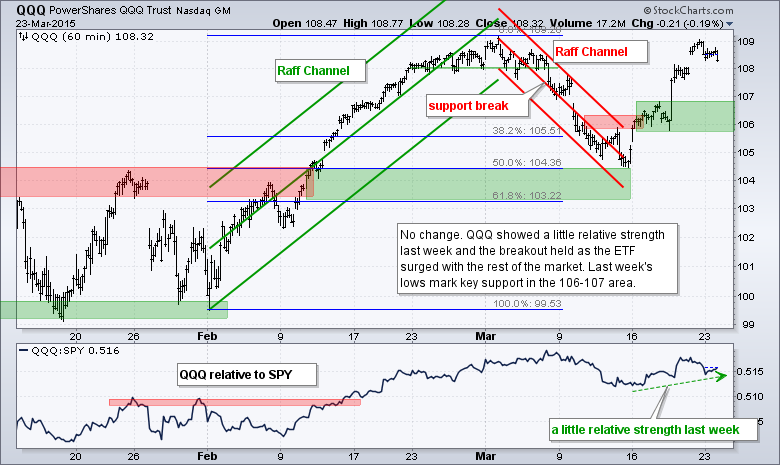
- SPY and QQQ are a bit short-term overbought after sharp advances last week, but remain in clear uptrends (since March 16th).
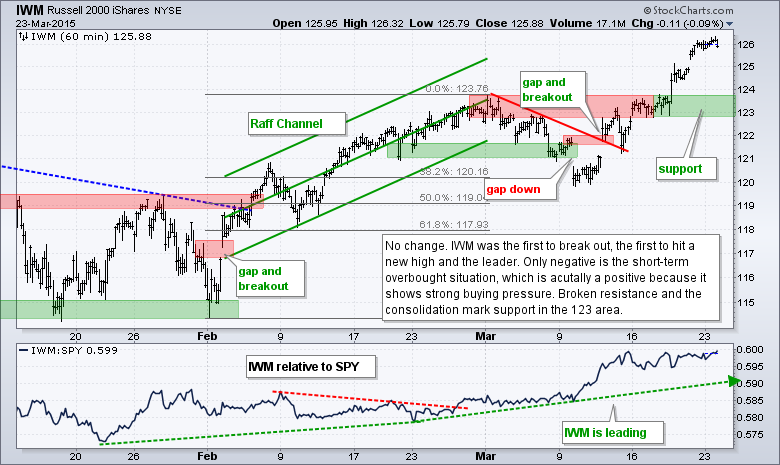
- IWM shows relative strength overall and remains in an uptrend (since March 12th).
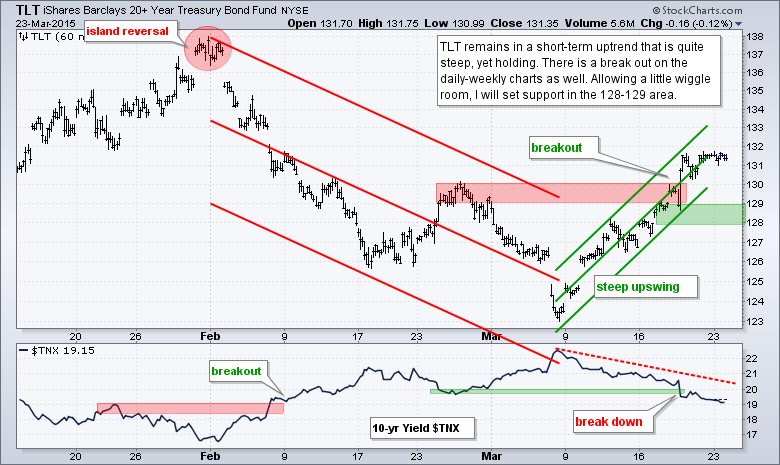
- TLT remains in a steep uptrend.
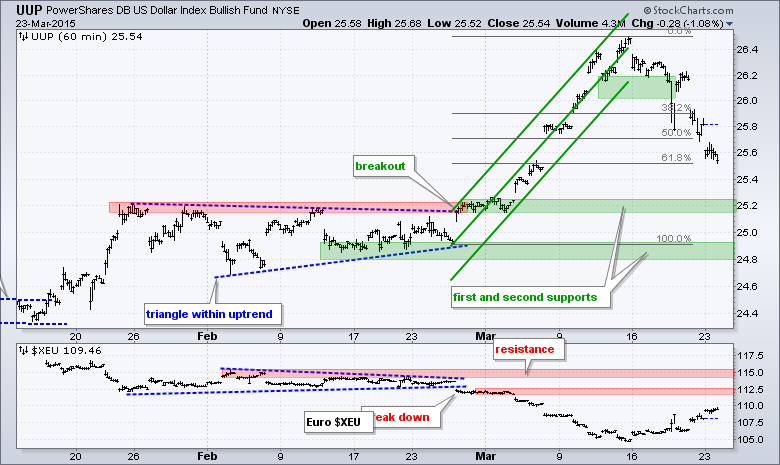
- UUP fell sharply over the last few days, but this is still considered a correction within a bigger uptrend.
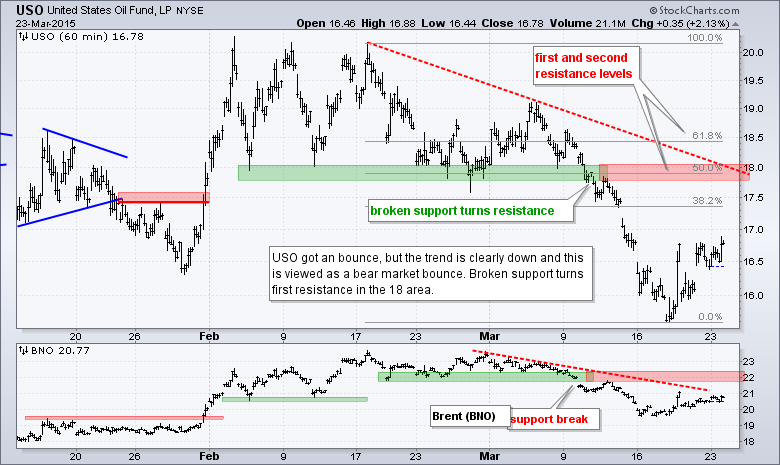
- USO bounced as the Dollar fell, but remains in a downtrend overall.
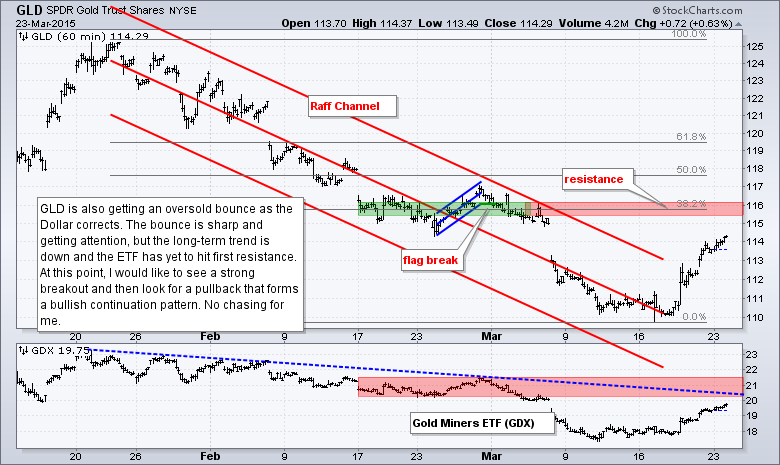
- GLD got a big bounce as the Dollar fell, but remains in a downtrend overall.
Breadth was mostly negative on Monday, but small-cap breadth managed to finish positive. S&P 1500 AD Percent ($SUPADP) finished at -4.80% on Monday and S&P SmallCap AD Percent ($SMLADP) finished at +13%. Overall, the 10-day SMA for S&P 1500 AD Percent ($SUPADP) is well above zero and breadth supports a short-term uptrend.
No change. The risk indicators remain mixed (2 positive and 3 negative). The two stock-specific indicators are positive, but the RSP:SPY ratio is dragging its feet. Even though the Equal-Weight S&P 500 ETF (RSP) has been outperforming the S&P 500 SPDR (SPY) the last two weeks, this outperformance is not that pronounced because the uptrend is not very steep for the price relative (RSP:SPY ratio). Nevertheless, it is an uptrend for now.
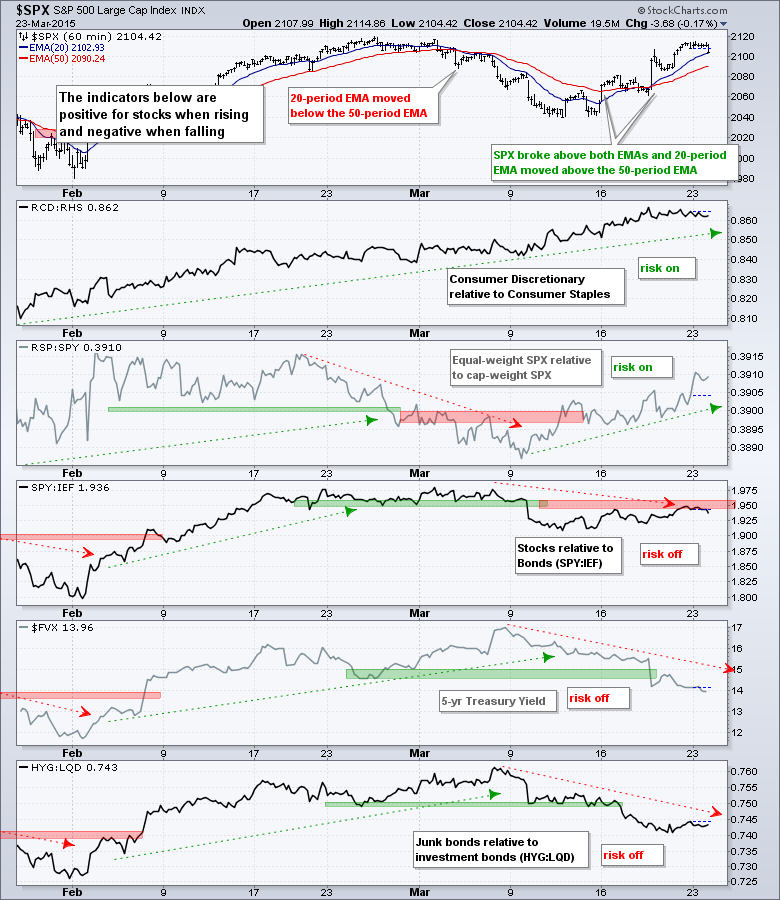
No change. The three bond-related indicators remain negative. The 5-year Treasury Yield ($FVX) has been trending lower for two weeks and this means money is moving into short-term Treasuries, which shows risk aversion. The HYG:LQD ratio broke down last week and has been trending lower the last two weeks. This shows risk aversion in the corporate bond market because junk bonds are underperforming investment grade bonds.
The short-term evidence favors the bulls. The stock indicators are all bullish right now. IWM started with the first breakout and is leading with a new high. Breadth is not that impressive, but AD Percent is strong enough and supportive of the uptrend. The consumer discretionary sector is outperforming the consumer staples sector and this is the most economically sensitive sector.
**************************************************************
**************************************************************
**************************************************************
**************************************************************
**************************************************************
**************************************************************
***************************************************************
Key Reports and Events (all times Eastern):
Mon - Mar 23 - 10:00 - Existing Home Sales
Tue - Mar 24 - 08:30 - Consumer Price Index (CPI)
Tue - Mar 24 - 09:00 - FHFA Housing Price Index
Tue - Mar 24 - 10:00 - New Home Sales
Wed - Mar 25 - 07:00 - MBA Mortgage Index
Wed - Mar 25 - 08:30 - Durable Orders
Wed - Mar 25 - 10:30 - Crude Oil Inventories
Thu - Mar 26 - 08:30 - Initial Jobless Claims
Thu - Mar 26 - 10:30 - Natural Gas Inventories
Fri - Mar 27 - 08:30 - GDP
Fri - Mar 27 - 10:00 - Michigan Sentiment
This commentary is designed to stimulate thinking. This analysis is not a recommendation to buy, sell, hold or sell short any security (stock ETF or otherwise). We all need to think for ourselves when it comes to trading our own accounts. First, it is the only way to really learn. Second, we are the only ones responsible for our decisions. Think of these charts as food for further analysis. Before making a trade, it is important to have a plan. Plan the trade and trade the plan. Among other things, this includes setting a trigger level, a target area and a stop-loss level. It is also important to plan for three possible price movements: advance, decline or sideways. Have a plan for all three scenarios BEFORE making the trade. Consider possible holding times. And finally, look at overall market conditions and sector/industry performance.


