Trading was mixed again on Tuesday. Selling pressure hit SPY, QQQ and MDY, but IJR and IWM finished slightly positive. The finance and utilities sectors led the way lower. The Home Construction iShares (ITB) and Home Builders SPDR (XHB) bucked the selling pressure and finished with nice gains. The Retail SPDR (XRT) held up well and finished with a small gain. Weakness in the Networking iShares (IGN) and Semiconductor SPDR (XSD) weighed on the tech sector, but the Internet ETF (FDN) countered with a small gain.
**This chart analysis is for educational purposes only, and should not
be construed as a recommendation to buy, sell or sell-short said securities**
Short-term Overview (Wednesday, 25-March-2015):
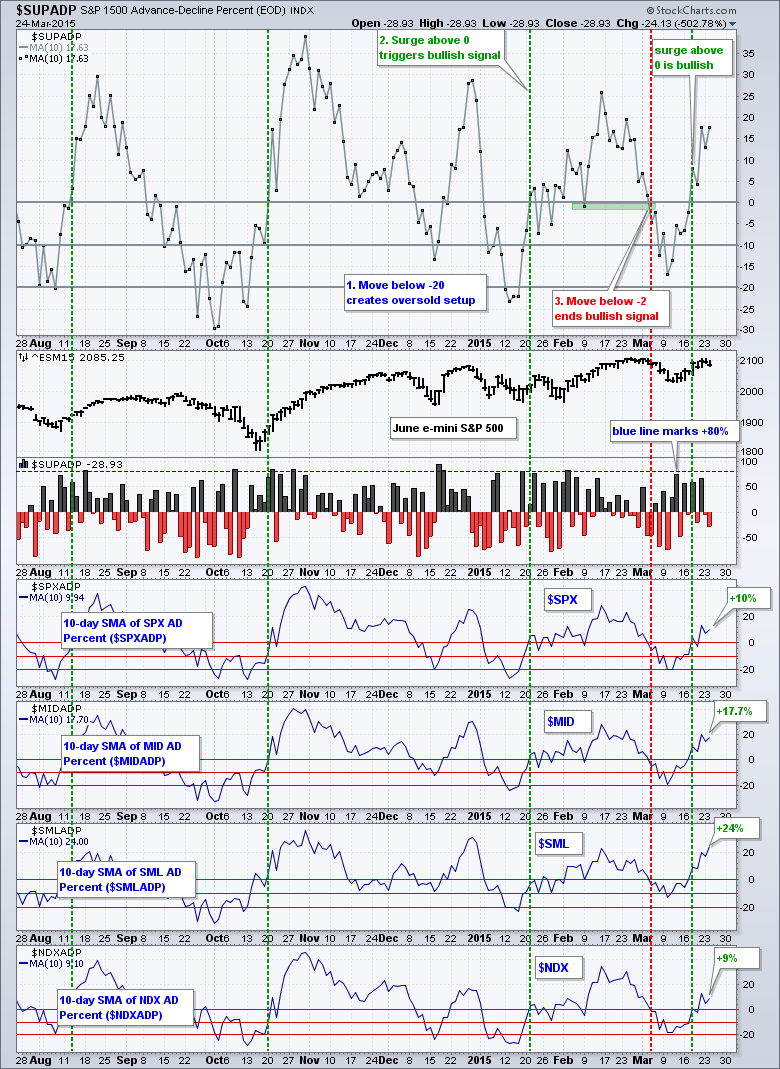
- Breadth turned bullish when the 10-day SMA for AD Percent moved above zero on March 18th.
- The two stock-related risk indicators are positive, but the three bond-related indicators are negative.
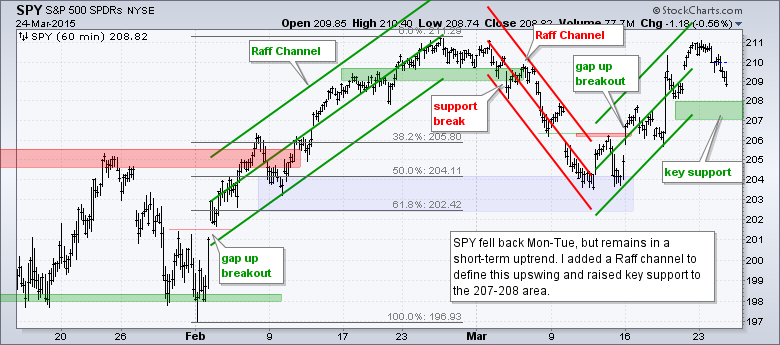
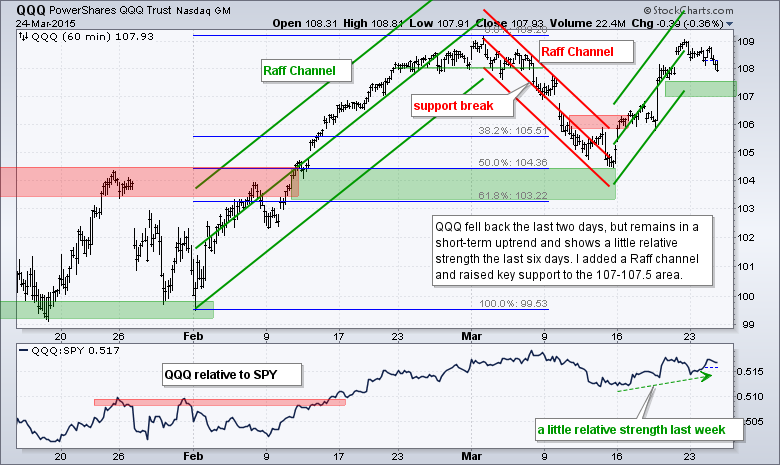
- SPY and QQQ fell back over the last two days, but remain in short-term uptrends (since March 16th).
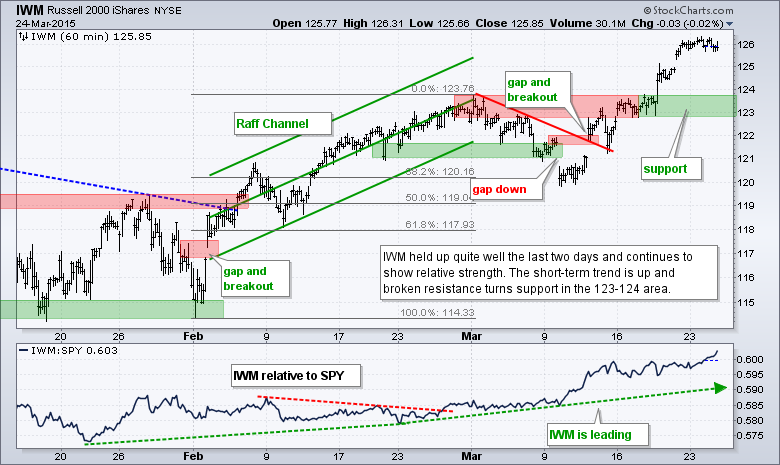
- IWM shows relative strength overall and remains in an uptrend (since March 12th).
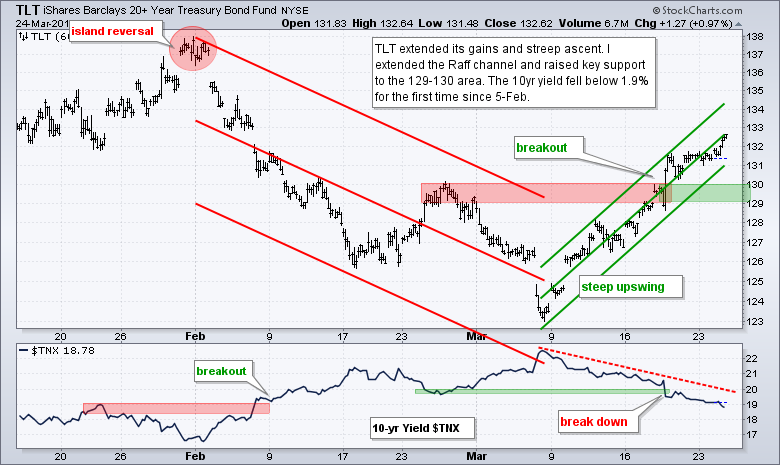
- TLT extended on its breakout and remains in a steep uptrend.
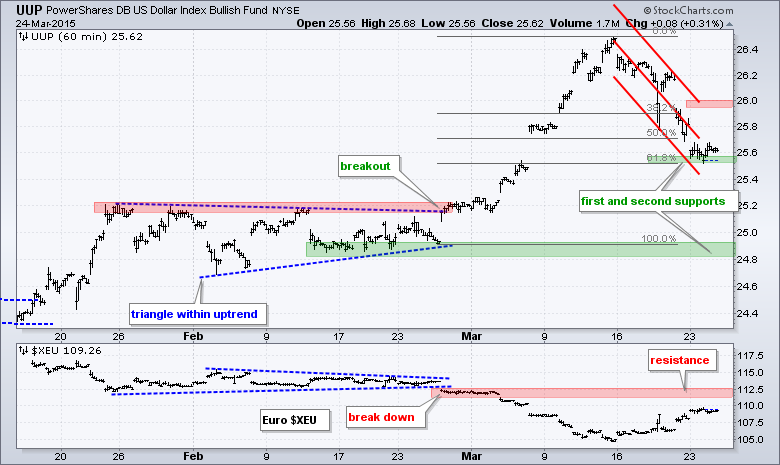
- UUP fell sharply over the last few days, but is firming near the 62% retracement.
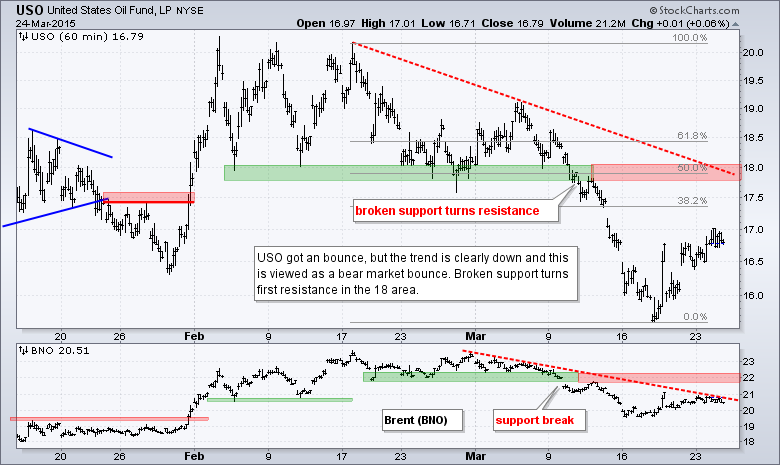
- USO bounced as the Dollar fell, but remains in a downtrend overall.
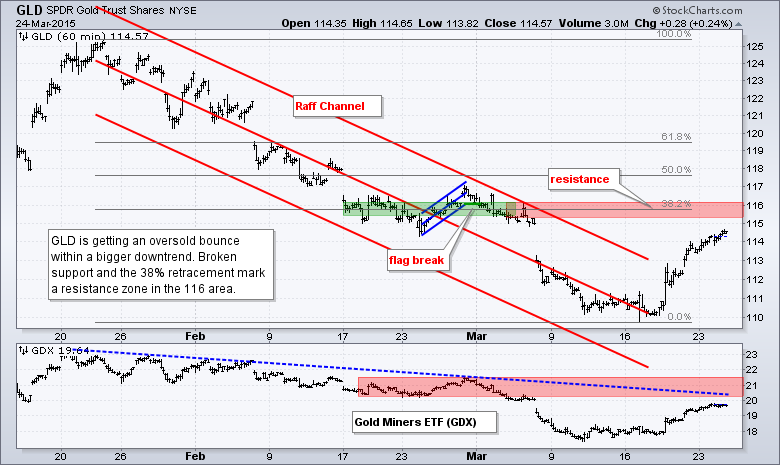
- GLD got a big bounce as the Dollar fell, but remains in a downtrend overall.
Short-term breadth remains bullish overall. Breadth was mostly negative again on Tuesday, but small-cap breadth managed to finish positive. S&P 1500 AD Percent ($SUPADP) finished at -29% and S&P SmallCap AD Percent ($SMLADP) finished at +1.3%. The 10-day SMA for S&P 1500 AD Percent advanced because a big negative number was dropped from the 10-day SMA and a smaller negative number added.
The risk indicators remain mixed. Most important for stocks, the two stock-specific indicators are positive. The consumer discretionary sector continues to outperform the consumer staples sector, and the S&P 500 Equal-Weight Index is outperforming the cap-weight S&P 500.
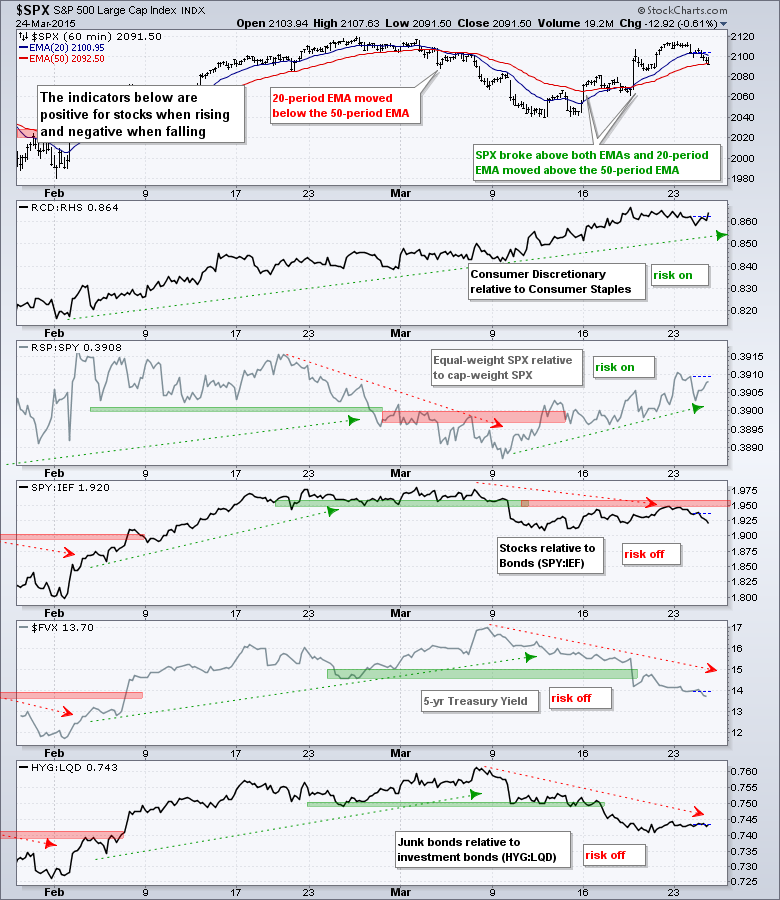
The three bond-related indicators are negative because bonds have been strong the last two weeks. SPY is underperforming the 7-10 YR T-Bond ETF (IEF). The 5-year Treasury yield and the HYG:LQD ratio have been in downtrends since 9-March. This means money is moving into short-term Treasury bonds and this shows a penchant for safety. Relative weakness in the High-Yield Bond ETF (HYG) shows risk-aversion in the bond market.
The short-term evidence favors the bulls. Small-caps are leading large-caps, consumer discretionary is leading consumer staples and short-term breadth favors the bulls. IWM is the strongest of the three major index ETFs (QQQ, SPY and IWM). There are some concerns with strength in bonds because Treasuries extended their gains on Monday-Tuesday. Money moving into Treasuries is money not available for stocks and Treasuries are viewed a safe-haven assets (risk aversion).
**************************************************************
**************************************************************
**************************************************************
**************************************************************
**************************************************************
**************************************************************
***************************************************************
Key Reports and Events (all times Eastern):
Wed - Mar 25 - 07:00 - MBA Mortgage Index
Wed - Mar 25 - 08:30 - Durable Orders
Wed - Mar 25 - 10:30 - Crude Oil Inventories
Thu - Mar 26 - 08:30 - Initial Jobless Claims
Thu - Mar 26 - 10:30 - Natural Gas Inventories
Fri - Mar 27 - 08:30 - GDP
Fri - Mar 27 - 10:00 - Michigan Sentiment
This commentary is designed to stimulate thinking. This analysis is not a recommendation to buy, sell, hold or sell short any security (stock ETF or otherwise). We all need to think for ourselves when it comes to trading our own accounts. First, it is the only way to really learn. Second, we are the only ones responsible for our decisions. Think of these charts as food for further analysis. Before making a trade, it is important to have a plan. Plan the trade and trade the plan. Among other things, this includes setting a trigger level, a target area and a stop-loss level. It is also important to plan for three possible price movements: advance, decline or sideways. Have a plan for all three scenarios BEFORE making the trade. Consider possible holding times. And finally, look at overall market conditions and sector/industry performance.


