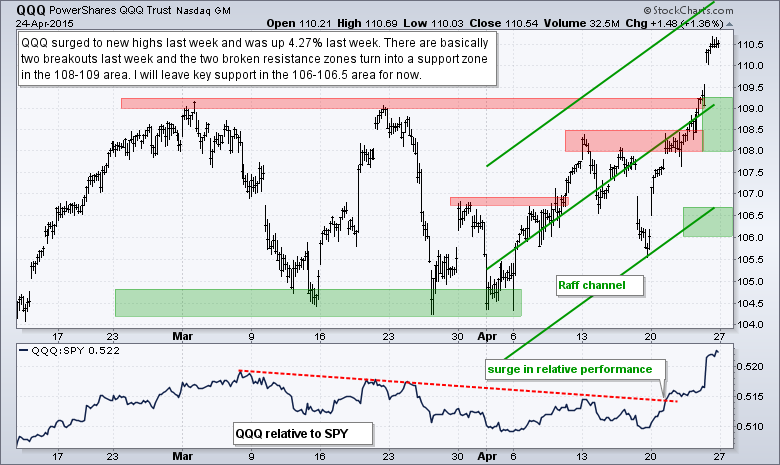
It was all about big techs on Friday as QQQ surged over 1%. The rest of the market was mixed as IWM edged lower and SPY edged higher. Strength in Amazon (+14%) lifted the Consumer Discretionary SPDR (XLY) and strength in Microsoft (+10.5%) lifted the Technology SPDR (XLK). The Utilities SPDR (XLU) also showed upside leadership with a 1% gain. The technology sector was quite split because big gains in the Internet ETF (FDN) and Cloud Computing ETF (SKYY) were offset with a sizable loss in the Semiconductor iShares (SOXX). Elsewhere, the Newmont Mining (NEM) surged over 6%, but the Gold Miners ETF (GDX) fell 2% and the Gold SPDR (GLD) was down 1.4%.
**This chart analysis is for educational purposes only, and should not
be construed as a recommendation to buy, sell or sell-short said securities**
Short-term Overview (Monday, 27-April-2015):
- Short-term breadth indicators remain bullish.
- The sectors are slightly bullish with three trending up and two flat.
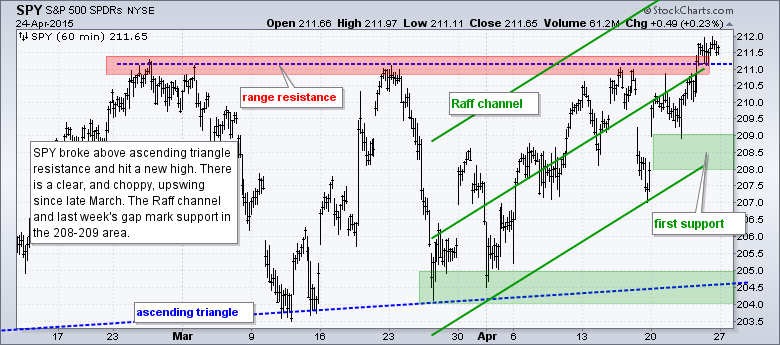
- SPY and QQQ hit new highs last week and remain in short-term uptrends.
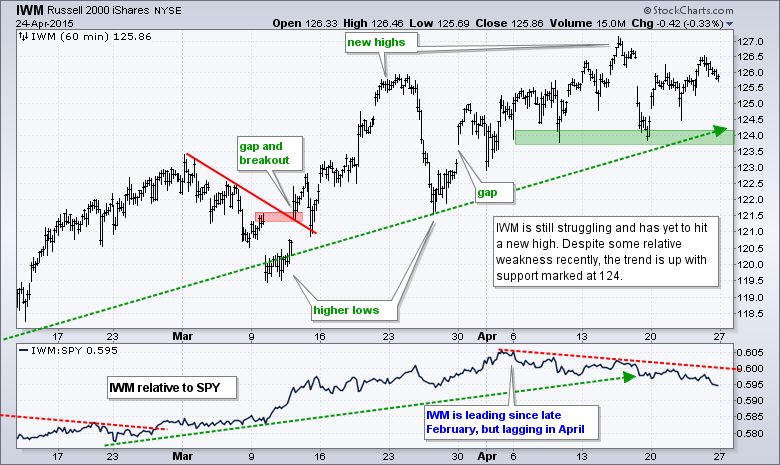
- IWM has yet to hit a new high, but remains in a short-term uptrend.
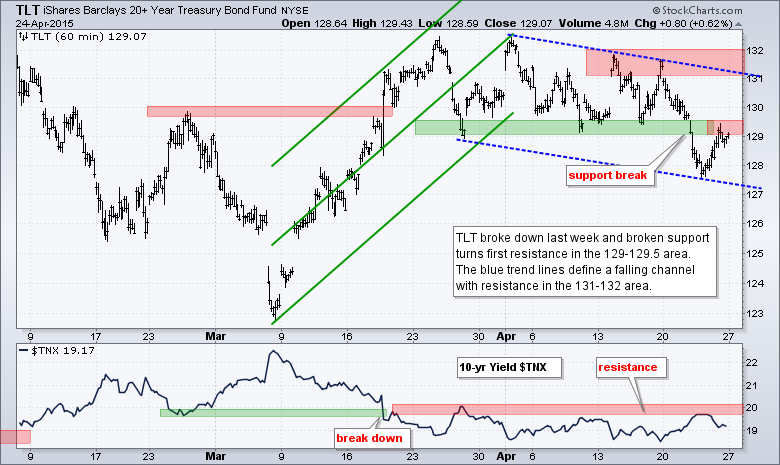
- TLT broke consolidation support to reverse its uptrend last week.
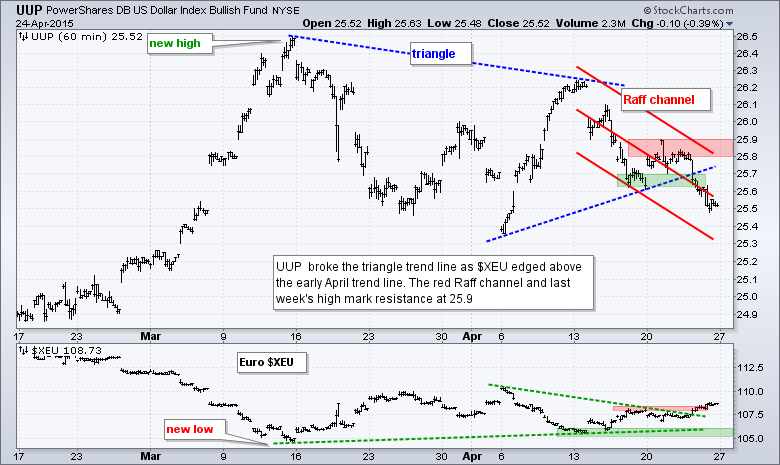
- UUP broke below the triangle trend line last week and remains in a short-term downtrend.
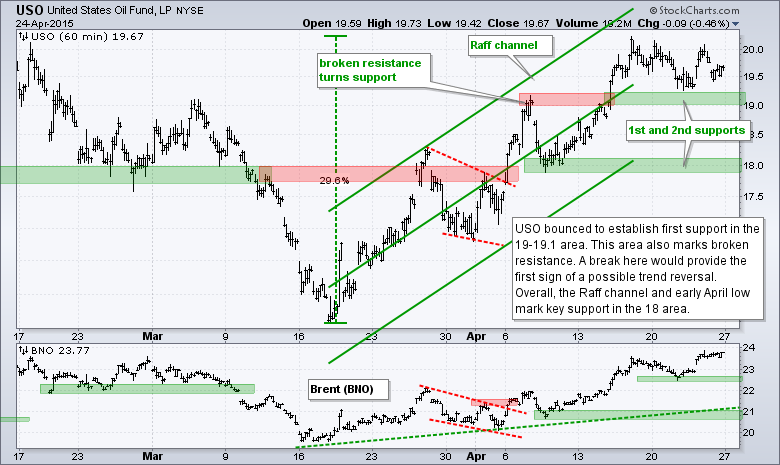
- USO stalled last week, but remains in a short-term uptrend.
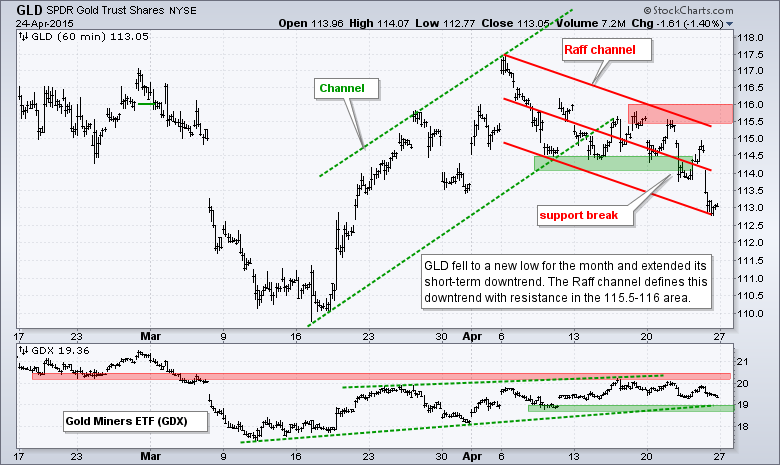
- GLD broke support last week and remains in a short-term downtrend.
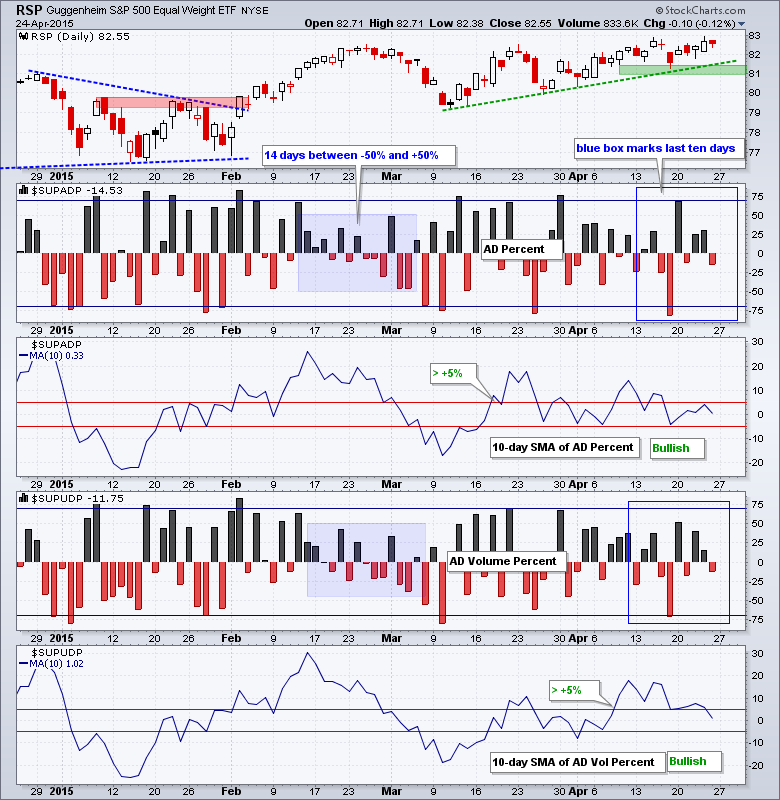
The Equal-Weight S&P 500 ETF (RSP) remains in a slow and steady short-term uptrend with support at 81. Except for a big negative dip on April 17th and a big positive surge on April 18th, breadth has been uninspiring this month because the other 15 days have been between -50% and +50%. The 10-day SMAs remain new bullish and will not turn bearish until they move below -5%.
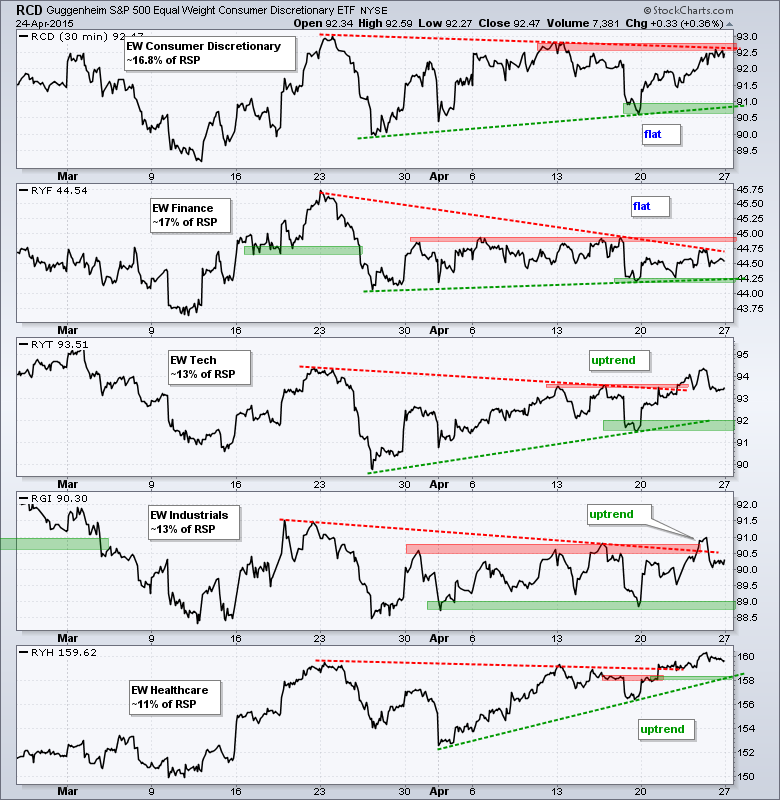
The short-term trends for the five big sectors remain mixed with three up and two flat. I am counting the Equal-Weight Consumer Discretionary ETF (RCD) as flat because it remains below the mid April high. The Equal-weight Finance ETF (RYF) is the weakest of the five because it was the only one that did not fully recover from the sharp decline on April 17th. The Equal-weight Technology ETF (RYT), Equal-weight Industrials ETF (RGI) and Equal-weight Consumer Staples ETF (RHS) all exceeded their mid April highs last week and remain in short-term uptrends.
**************************************************************
**************************************************************
**************************************************************
**************************************************************
**************************************************************
**************************************************************
**************************************************************
***************************************************************
Key Reports and Events (all times Eastern):
Tue - Apr 28 - 09:00 - Case-Shiller Housing Index
Tue - Apr 28 - 10:00 - Consumer Confidence
Wed - Apr 29 - 07:00 - MBA Mortgage Purchase Index
Wed - Apr 29 - 10:00 - Pending Home Sales
Wed - Apr 29 - 10:30 - Oil Inventories
Wed - Apr 29 - 14:00 - FOMC Rate Decision
Thu - Apr 30 - 08:30 - Initial Jobless Claims
Thu - Apr 30 - 08:30 - PCE Prices
Thu - Apr 30 - 08:30 - Personal Income & Personal Spending
Thu - Apr 30 - 09:45 - Chicago PMI
Thu - Apr 30 - 10:30 - Natural Gas Inventories
Fri - May 01 - 08:15 - ADP Employment Report
Fri - May 01 - 10:00 - Construction Spending
Fri - May 01 - 10:00 - ISM Manufacturing Index
Fri - May 01 - 10:00 - Michigan Sentiment
Fri - May 01 - 17:00 - Auto-Truck Sales
This commentary is designed to stimulate thinking. This analysis is not a recommendation to buy, sell, hold or sell short any security (stock ETF or otherwise). We all need to think for ourselves when it comes to trading our own accounts. First, it is the only way to really learn. Second, we are the only ones responsible for our decisions. Think of these charts as food for further analysis. Before making a trade, it is important to have a plan. Plan the trade and trade the plan. Among other things, this includes setting a trigger level, a target area and a stop-loss level. It is also important to plan for three possible price movements: advance, decline or sideways. Have a plan for all three scenarios BEFORE making the trade. Consider possible holding times. And finally, look at overall market conditions and sector/industry performance.


