Stocks got the old pop and drop on Monday as the S&P 500 surged to a new high in the morning and then worked its way lower the rest of the day. The index closed with a modest loss of .41%. IWM led the way lower with a 1.10% loss and small-caps have been lagging since early April. Eight of the nine sectors were down with healthcare and utilities leading lower. The technology and materials sector gained ground. Steel and mining stocks led the materials sector higher on word that the Chinese central bank may pursue QE. As far as the US market is concerned, I am more concerned with relative weakness in the Home Construction iShares (ITB), which fell 1.19% and the Retail SPDR (XRT), which did not confirm the new high in SPY.
**This chart analysis is for educational purposes only, and should not
be construed as a recommendation to buy, sell or sell-short said securities**
Short-term Overview (Tuesday, 28-April-2015):
- Short-term breadth indicators remain bullish.
- The sectors are mixed with two in uptrends, two flat and one in a downtrend.
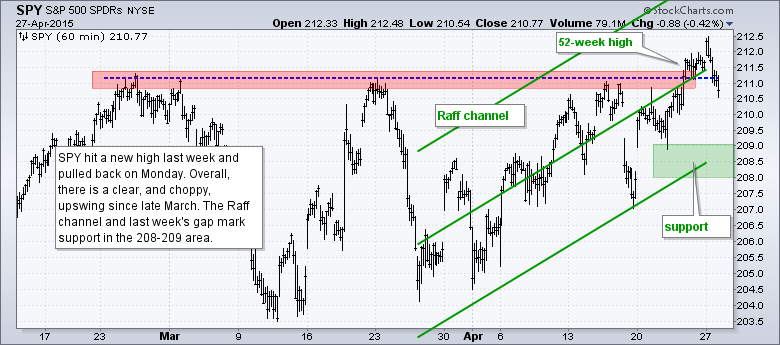
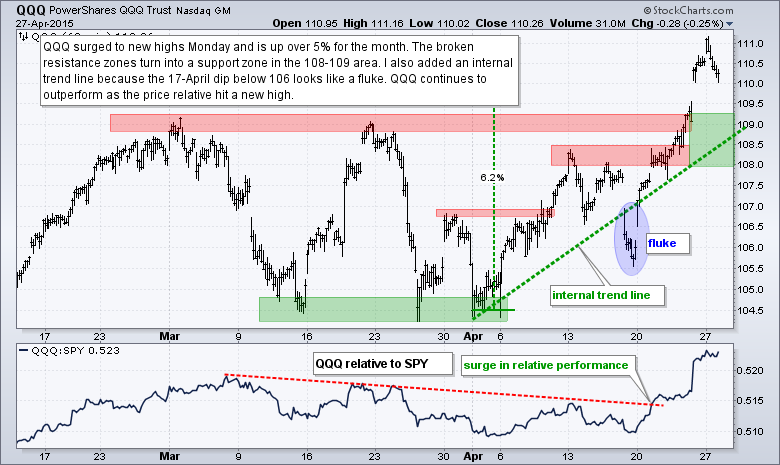
- SPY and QQQ hit new highs Monday and remain in short-term uptrends.
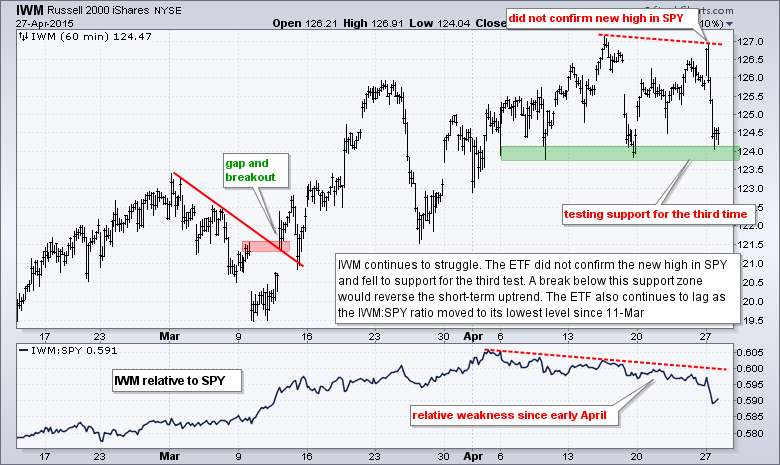
- IWM did not confirm the new high in SPY and is testing support already.
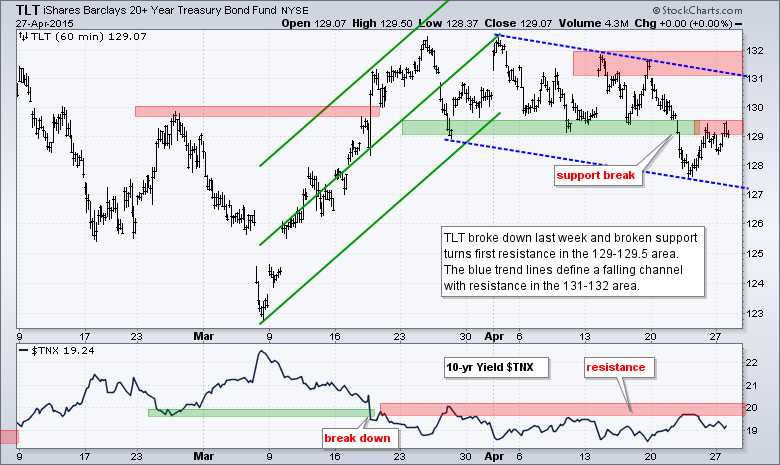
- TLT broke consolidation support to reverse its uptrend last week.
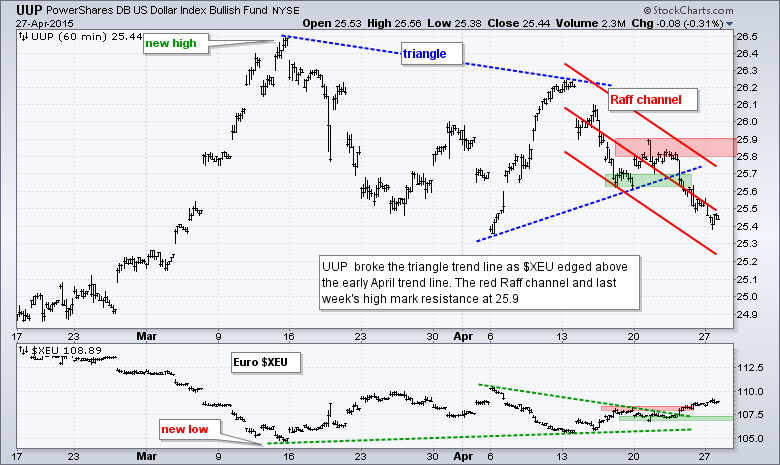
- UUP broke below the triangle trend line last week and remains in a short-term downtrend.
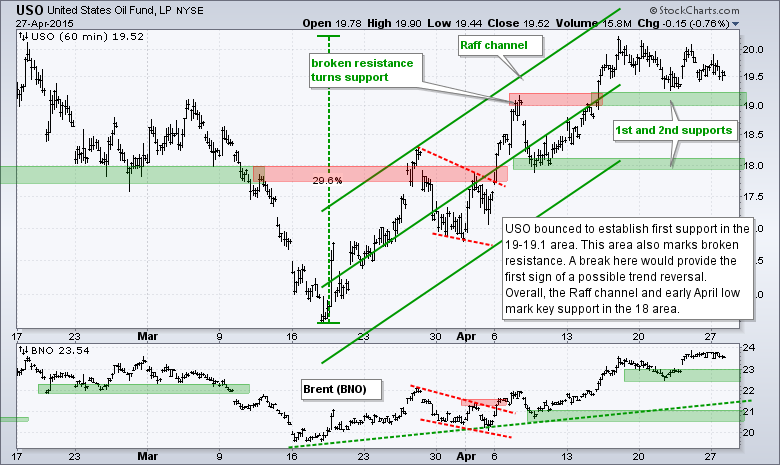
- USO stalled since last week, but remains in a short-term uptrend.
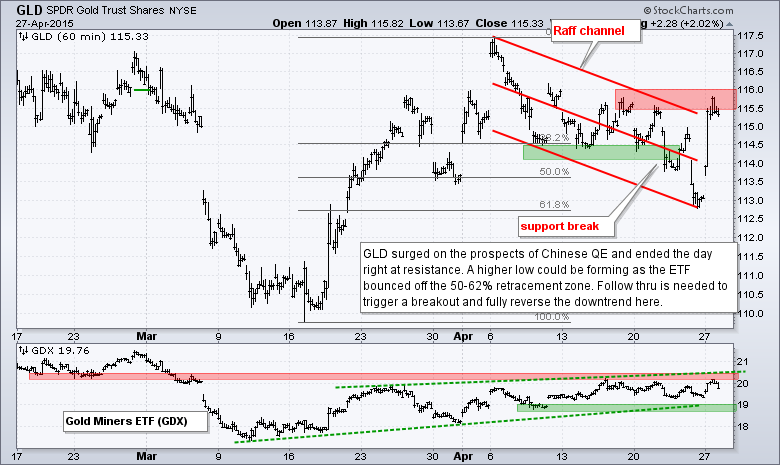
- GLD surged off a key retracement zone and is testing short-term resistance.
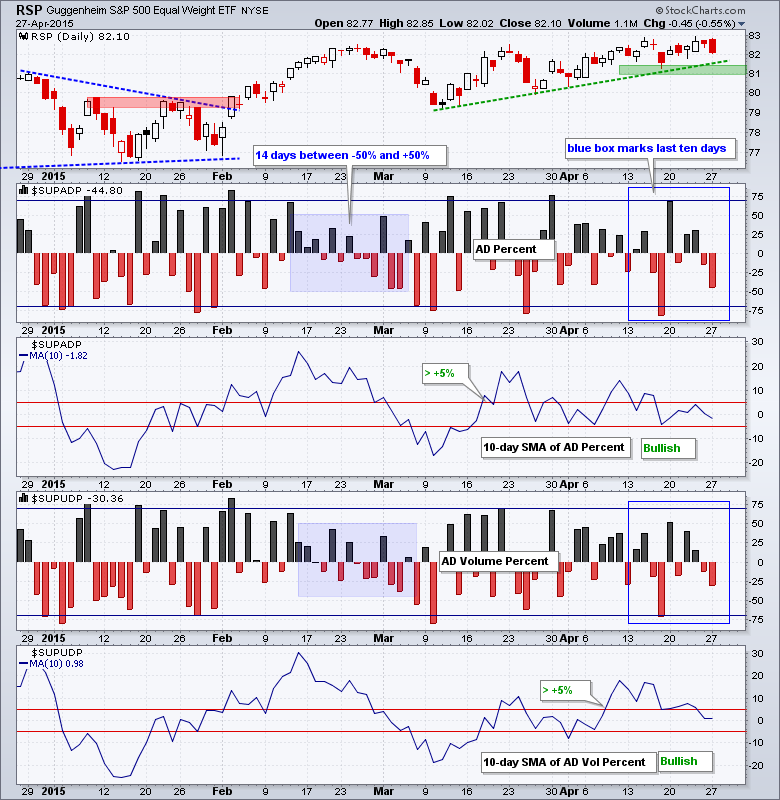
The Equal-Weight S&P 500 ETF (RSP) fell .55% on Monday and erased around half of last week's gains. The short-term trend is still up, but looks rather fragile with key support set at 81. AD Percent and AD Volume Percent were negative, but neither exceeded -50% as selling pressure was rather contained. The 10-day SMAs remain bullish because they have yet to cross below -5%. The 10-day SMA for AD Percent is at -1.82% and it would not take much selling pressure to push this one into negative territory.
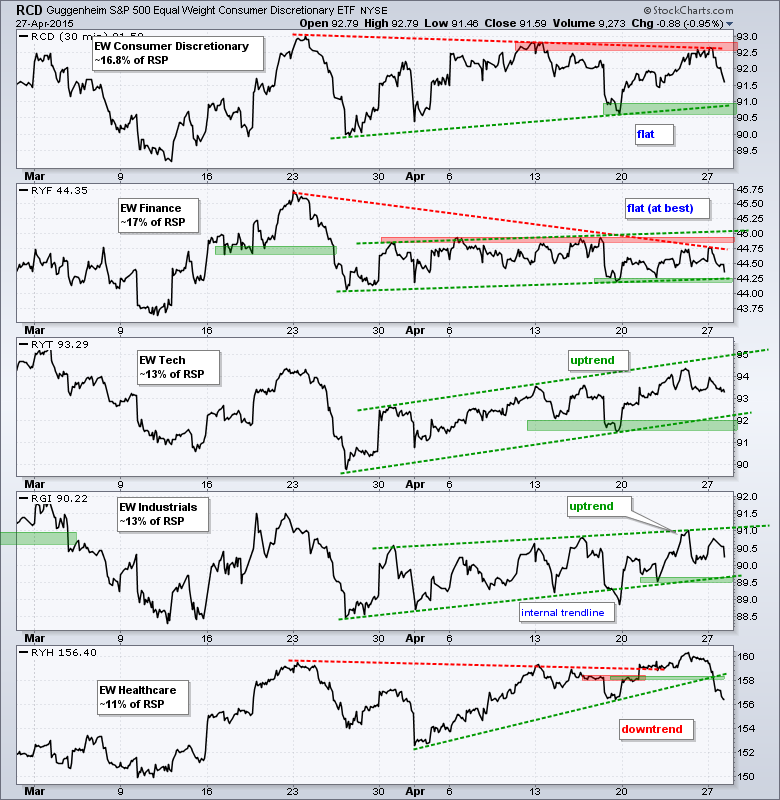
The equal-weight sectors are mixed. The Equal-Weight Consumer Discretionary ETF (RCD) fell back from resistance and remains in a trading range. The Equal-weight Finance ETF (RYF) has gone nowhere since late March and remains in a rather tight trading range. The Equal-weight Technology ETF (RYT) and Equal-weight Industrials ETF (RGI) are the only two in short-term uptrends. Note that I elected to draw an internal trend line for RGI and mark support at 89.50. The Equal-weight Healthcare ETF (RYH) fell 2% on Monday and broke support to start a short-term downtrend. While this does not affect the bigger trend, it is hard to ignore a 2% decline and trend line break short-term.
**************************************************************
**************************************************************
**************************************************************
**************************************************************
**************************************************************
**************************************************************
**************************************************************
***************************************************************
Key Reports and Events (all times Eastern):
Tue - Apr 28 - 09:00 - Case-Shiller Housing Index
Tue - Apr 28 - 10:00 - Consumer Confidence
Wed - Apr 29 - 07:00 - MBA Mortgage Purchase Index
Wed - Apr 29 - 10:00 - Pending Home Sales
Wed - Apr 29 - 10:30 - Oil Inventories
Wed - Apr 29 - 14:00 - FOMC Rate Decision
Thu - Apr 30 - 08:30 - Initial Jobless Claims
Thu - Apr 30 - 08:30 - PCE Prices
Thu - Apr 30 - 08:30 - Personal Income & Personal Spending
Thu - Apr 30 - 09:45 - Chicago PMI
Thu - Apr 30 - 10:30 - Natural Gas Inventories
Fri - May 01 - 08:15 - ADP Employment Report
Fri - May 01 - 10:00 - Construction Spending
Fri - May 01 - 10:00 - ISM Manufacturing Index
Fri - May 01 - 10:00 - Michigan Sentiment
Fri - May 01 - 17:00 - Auto-Truck Sales
This commentary is designed to stimulate thinking. This analysis is not a recommendation to buy, sell, hold or sell short any security (stock ETF or otherwise). We all need to think for ourselves when it comes to trading our own accounts. First, it is the only way to really learn. Second, we are the only ones responsible for our decisions. Think of these charts as food for further analysis. Before making a trade, it is important to have a plan. Plan the trade and trade the plan. Among other things, this includes setting a trigger level, a target area and a stop-loss level. It is also important to plan for three possible price movements: advance, decline or sideways. Have a plan for all three scenarios BEFORE making the trade. Consider possible holding times. And finally, look at overall market conditions and sector/industry performance.


