Stocks finished strong on Friday and ended the week with modest gains. QQQ led the way with a 2.5% advance and is also the strongest for April. IWM and MDY lagged because they gained less than 1%. Industrials, energy, healthcare and technology led the sectors last week. Healthcare was most impressive because it has been one of the strongest sectors for months and the Equal-weight Healthcare ETF (RYH) is within 1% of a new high. Utilities, the Home Construction iShares (ITB), the Telecom iShares (IYZ) and the Telecom iShares (IYZ) were weak as interest rates edged higher last week. Trading could become quite volatile because earnings season kicks into gear and the retail sales report is on deck for Tuesday. Note that SPY and QQQ are still range bound since mid February.
**This chart analysis is for educational purposes only, and should not
be construed as a recommendation to buy, sell or sell-short said securities**
Short-term Overview (Monday, 13-April-2015):
- The short-term breadth indicators are bullish.
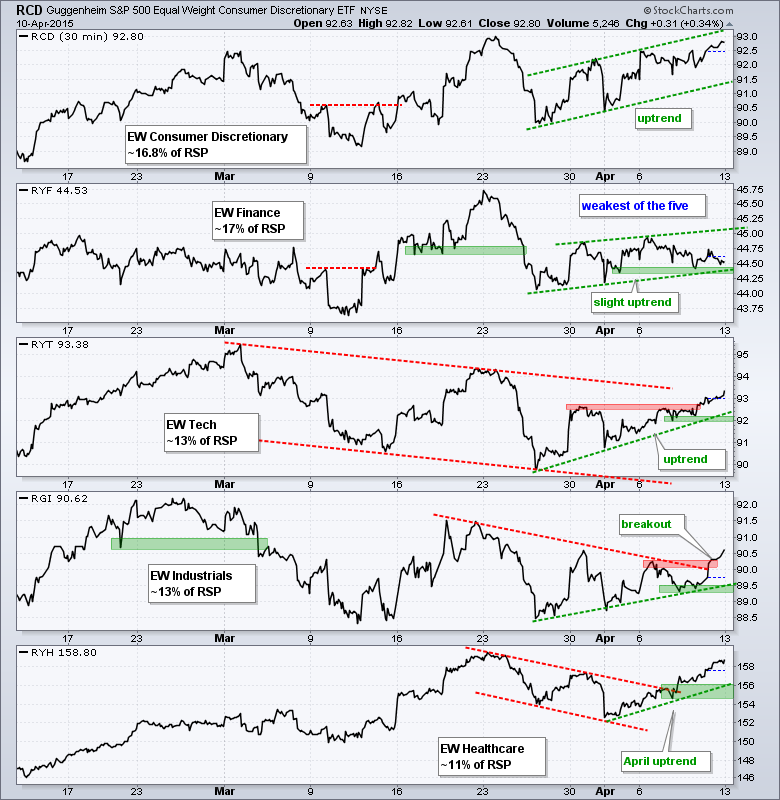
- All five big sectors are in short-term uptrends, but finance is the weakest.
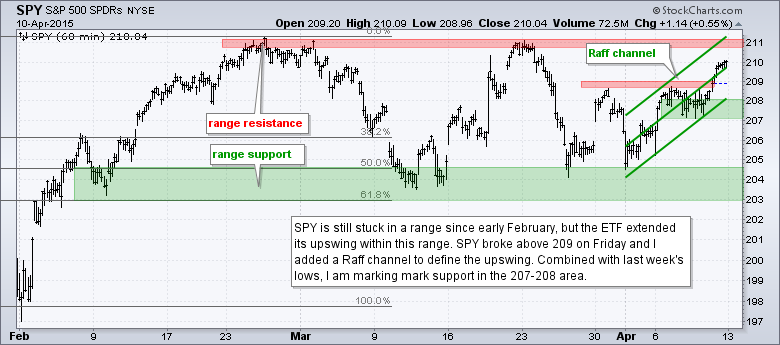
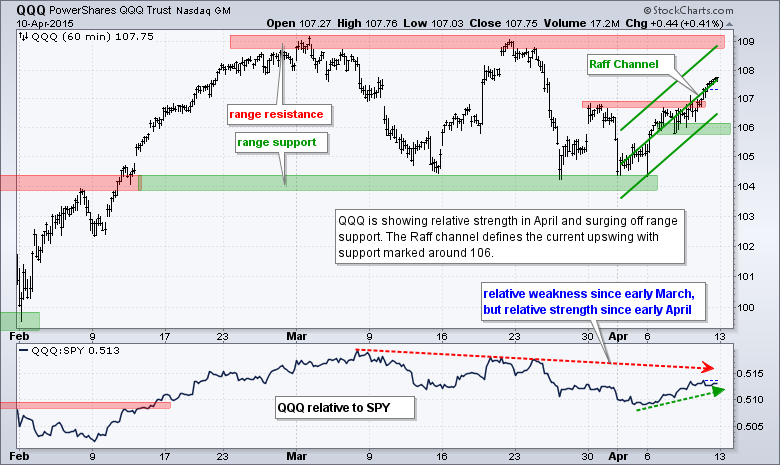
- SPY and QQQ are in upswings within larger trading ranges.
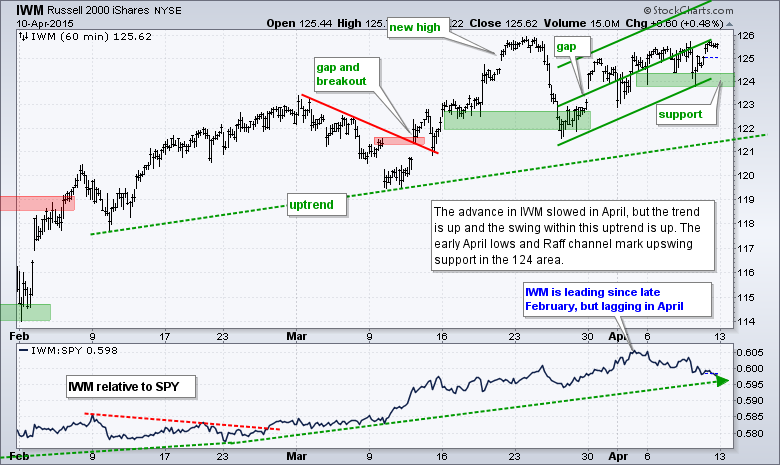
- IWM remains in an uptrend and is nearing its March high.
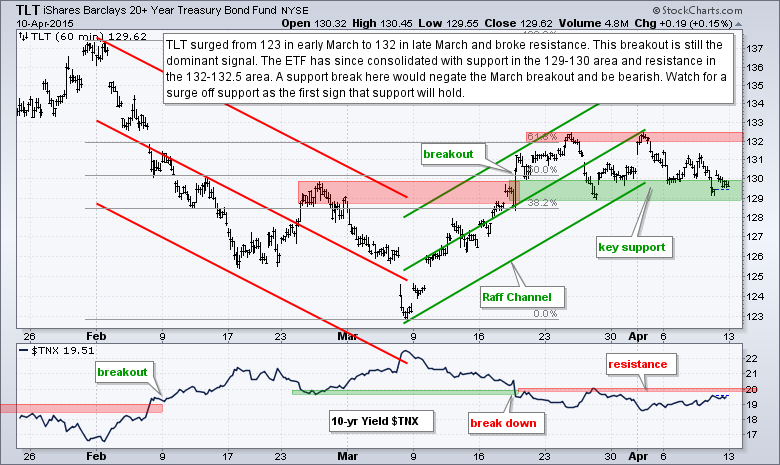
- TLT is testing support from the late March lows.
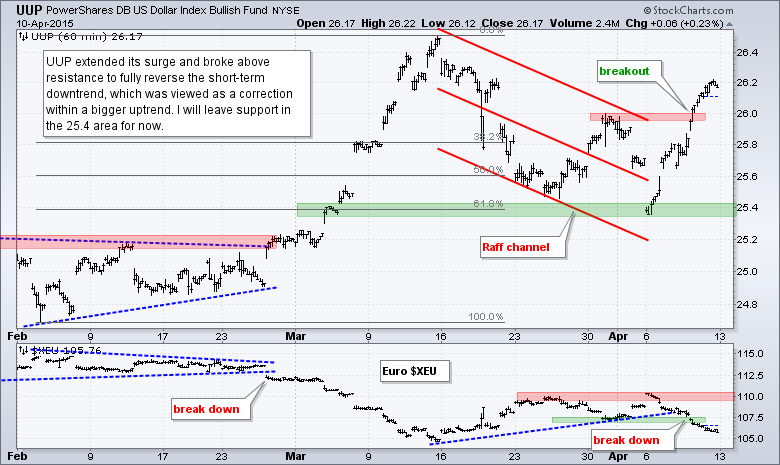
- UUP broke out last week and this breakout is holding.
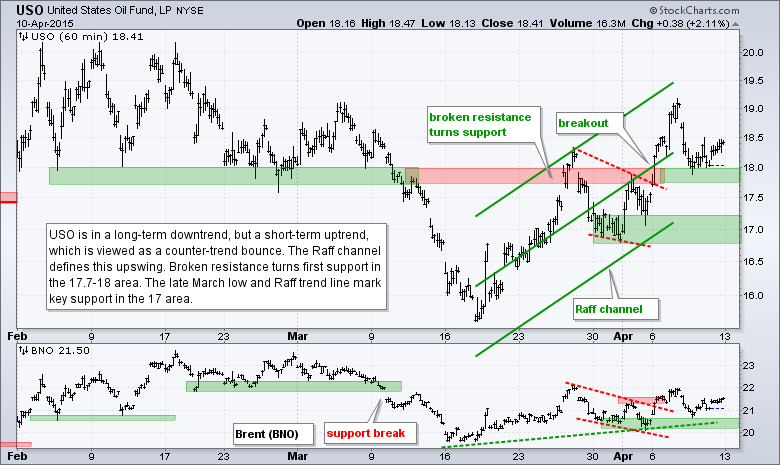
- USO remains in a short-term uptrend and is testing the breakout zone.
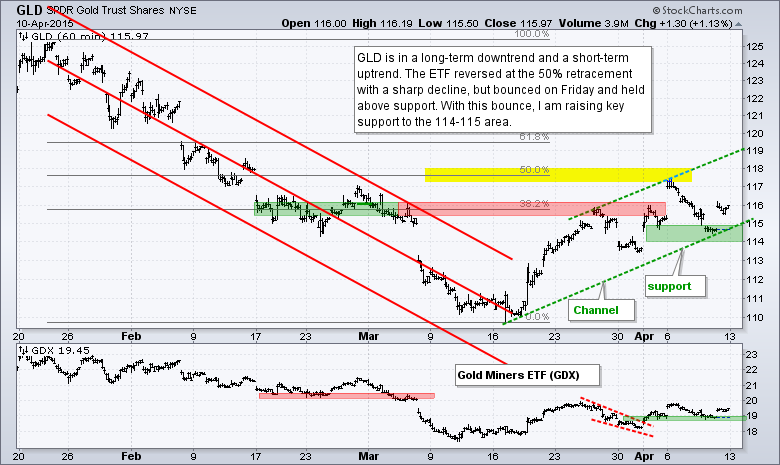
- GLD remains in a short-term uptrend and bounced off support on Friday.
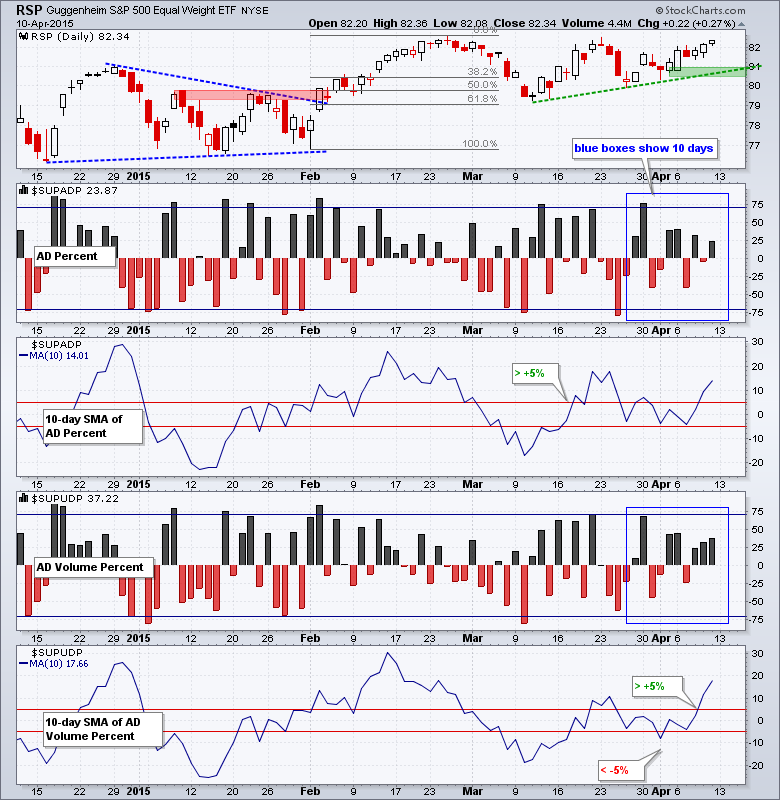
The Equal-Weight S&P 500 ETF (RSP) continues to work its way higher with an uptrend since mid March and key support remains at 80.50. Short-term breadth is uninspiring on a daily basis, but bullish overall because both 10-day SMAs are on bullish signals. The 10-day SMA for AD Percent turned bullish with a move above +5% on March 18th and the 10-day SMA for AD Volume Percent turned bullish with a move above +5% on April 9th. The daily readings have not been above +50% since late March though. Note that AD Volume Percent has been positive the last three days and this reflects strength in large-caps because they are the volume leaders.
All five equal-weight sector ETFs are in short-term uptrends, and the green trend lines define these uptrends. The Equal-Weight Consumer Discretionary ETF (RCD) and Equal-weight Healthcare ETF (RYH) are the strongest because they are the closest to new highs. The Equal-weight Industrials ETF (RGI) got a breakout with a big move on Friday. The Equal-weight Finance ETF (RYF) is the weakest of the three because it did not exceed its early April high and actually moved lower last week.
Note that I use these equal-weight sector ETFs because the SPDRs are dominated by large-caps. For example, GE weighs 9.59% in XLI and the top ten stocks account for almost 50% of the ETF. In contrast, GE accounts for 1.72% of RGI and the top ten stocks account for around 15% of the ETF. The Equal-weight Industrials ETF (RGI) is a better representative for the industrials sector as a whole.
**************************************************************
**************************************************************
**************************************************************
**************************************************************
**************************************************************
**************************************************************
**************************************************************
***************************************************************
Key Reports and Events (all times Eastern):
Tue - Apr 14 - 08:30 - Retail Sales
Tue - Apr 14 - 08:30 - Producer Price Index (PPI)
Wed - Apr 15 - 07:00 - MBA Mortgage Index
Wed - Apr 15 - 08:30 - Empire State Manufacturing
Wed - Apr 15 - 09:15 - Industrial Production
Wed - Apr 15 - 10:00 - NAHB Housing Market Index
Wed - Apr 15 - 10:30 - Oil Inventories
Wed - Apr 15 - 14:00 - Fed's Beige Book
Thu - Apr 16 - 08:30 - Initial Jobless Claims
Thu - Apr 16 - 08:30 - Housing Starts & Building Permits
Thu - Apr 16 - 10:00 - Philadelphia Fed
Thu - Apr 16 - 10:30 - Natural Gas Inventories
Fri - Apr 17 - 08:30 - Consumer Price Index (CPI)
Fri - Apr 17 - 10:00 - Michigan Sentiment
Fri - Apr 17 - 10:00 - Leading Economic Indicators
Wed - Apr 22 - 07:00 - MBA Mortgage Index
Wed - Apr 22 - 09:00 - FHFA Housing Price Index
Wed - Apr 22 - 10:00 - Existing Home Sales
Wed - Apr 22 - 10:30 - Oil Inventories
Thu - Apr 23 - 08:30 - Initial Jobless Claims
Thu - Apr 23 - 10:00 - New Home Sales
Thu - Apr 23 - 10:30 - Natural Gas Inventories
Fri - Apr 24 - 08:30 - Durable Goods Orders
Tue - Apr 28 - 09:00 - Case-Shiller Housing Index
Tue - Apr 28 - 10:00 - Consumer Confidence
Wed - Apr 29 - 07:00 - MBA Mortgage Purchase Index
Wed - Apr 29 - 10:00 - Pending Home Sales
Wed - Apr 29 - 10:30 - Oil Inventories
Wed - Apr 29 - 14:00 - FOMC Rate Decision
Thu - Apr 30 - 08:30 - Initial Jobless Claims
Thu - Apr 30 - 08:30 - PCE Prices
Thu - Apr 30 - 08:30 - Personal Income & Personal Spending
Thu - Apr 30 - 09:45 - Chicago PMI
Thu - Apr 30 - 10:30 - Natural Gas Inventories
Fri - May 01 - 08:15 - ADP Employment Report
Fri - May 01 - 10:00 - Construction Spending
Fri - May 01 - 10:00 - ISM Manufacturing Index
Fri - May 01 - 10:00 - Michigan Sentiment
Fri - May 01 - 17:00 - Auto-Truck Sales
This commentary is designed to stimulate thinking. This analysis is not a recommendation to buy, sell, hold or sell short any security (stock ETF or otherwise). We all need to think for ourselves when it comes to trading our own accounts. First, it is the only way to really learn. Second, we are the only ones responsible for our decisions. Think of these charts as food for further analysis. Before making a trade, it is important to have a plan. Plan the trade and trade the plan. Among other things, this includes setting a trigger level, a target area and a stop-loss level. It is also important to plan for three possible price movements: advance, decline or sideways. Have a plan for all three scenarios BEFORE making the trade. Consider possible holding times. And finally, look at overall market conditions and sector/industry performance.


