Stocks started weak, but quickly found their footing and moved higher. SPY and QQQ led and closed at their highest levels of the month. Small-caps lagged as IWM and IJR closed slightly lower. Eight of the nine sectors were up with the Energy SPDR (XLE) as the only standout performer (+1.6%). The Utilities SPDR (XLU) declined as the 10-YR Treasury Yield ($TNX) turned up and Treasuries turned down. Interest rate sensitive REITs were also hit as the REIT iShares (IYR) fell 1.76%.
**This chart analysis is for educational purposes only, and should not
be construed as a recommendation to buy, sell or sell-short said securities**
Short-term Overview (Friday, 10-April-2015):
- The short-term breadth indicators support a short-term uptrend.
- Four of the five big sectors are in short-term uptrends.
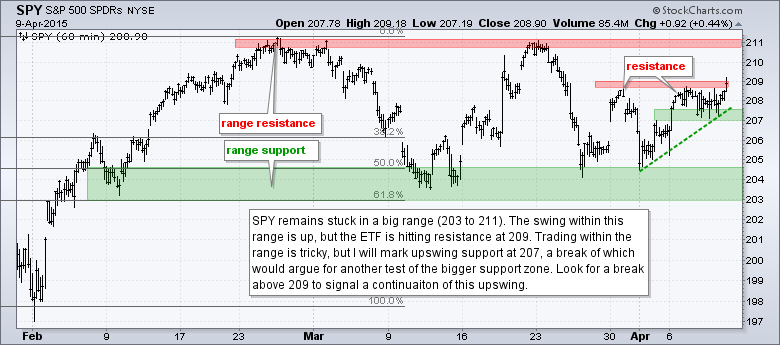
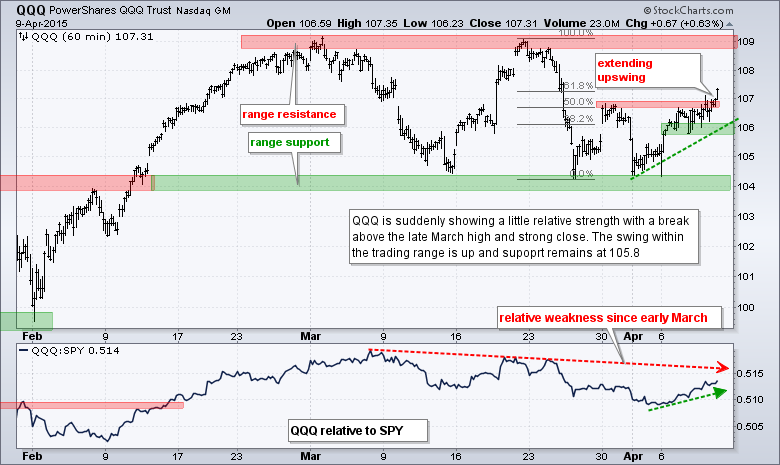
- SPY and QQQ are in upswings within larger trading ranges.
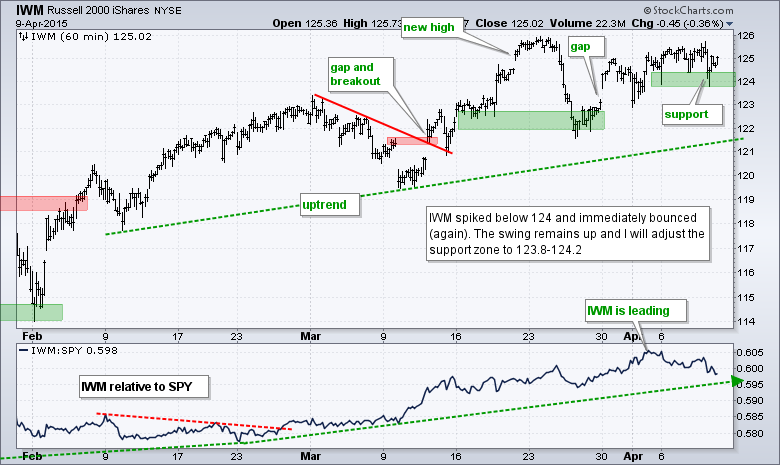
- IWM remains in an uptrend and shows relative strength.
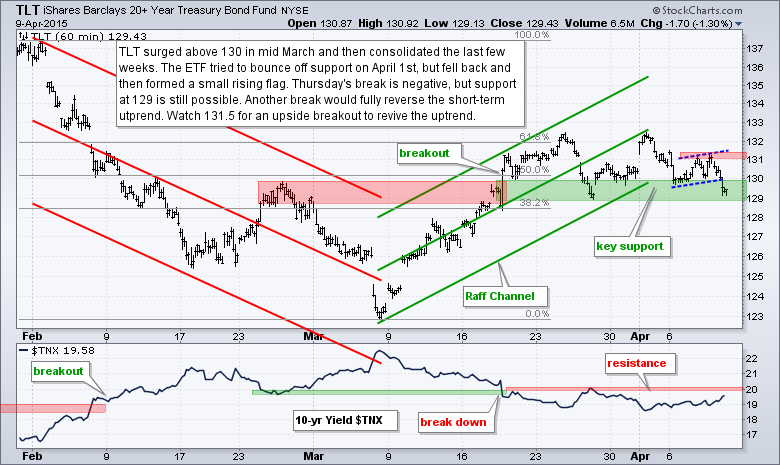
- TLT failed to hold its bounce and is testing support again.
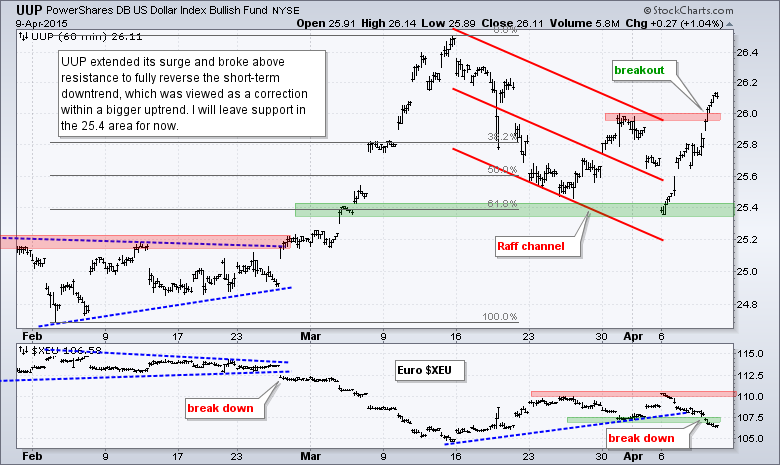
- UUP surged off the 62% retracement and broke out to reverse the short-term downtrend.
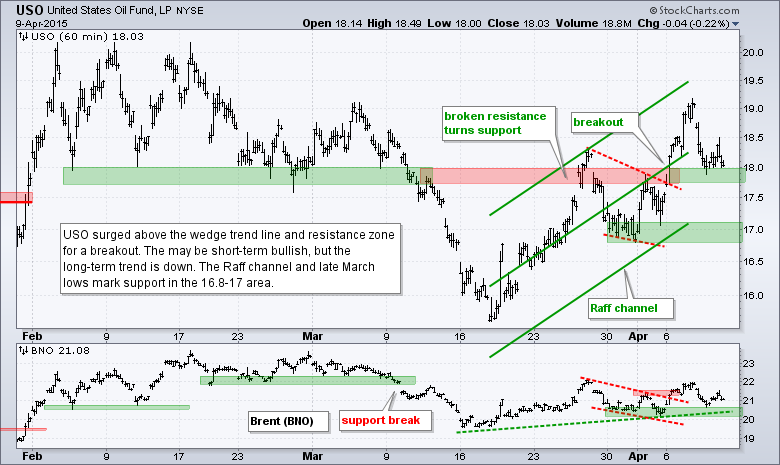
- USO plunged back to its breakout zone for its first support test.
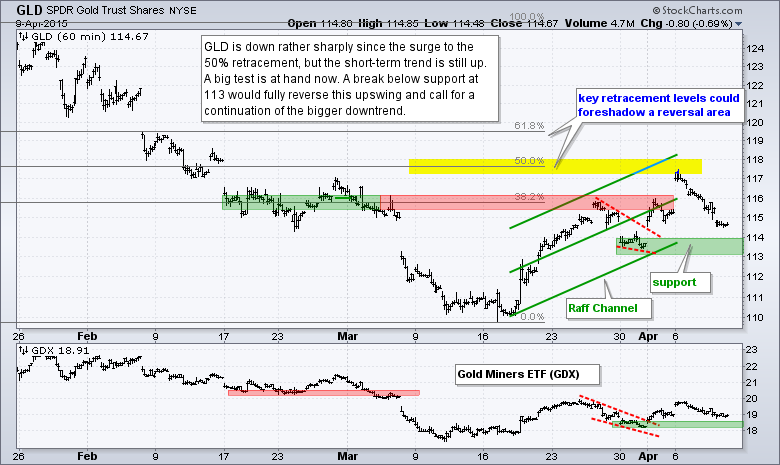
- GLD fell back this week, but remains in a short-term uptrend
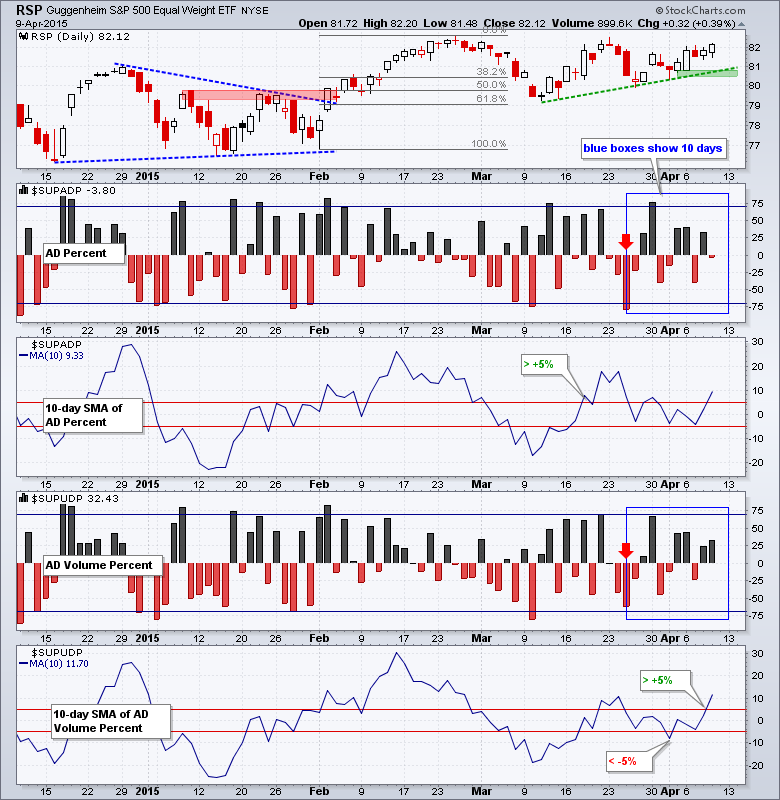
The Equal-Weight S&P 500 ETF (RSP) continues to work its way higher with an uptrend since mid March. Key support remains at 80.50. Short-term breadth improved as the 10-day SMAs for AD Percent and AD Volume Percent surged above +5%. This move is mostly because the 10-day moving averages dropped their big negative days from March 25th (red arrows). Notice that AD Percent finished negative on Thursday and AD Volume Percent finished at +32%, which is positive, but not that inspiring. Based on the 10-day SMAs, I will give breadth a short-term bullish bias now.
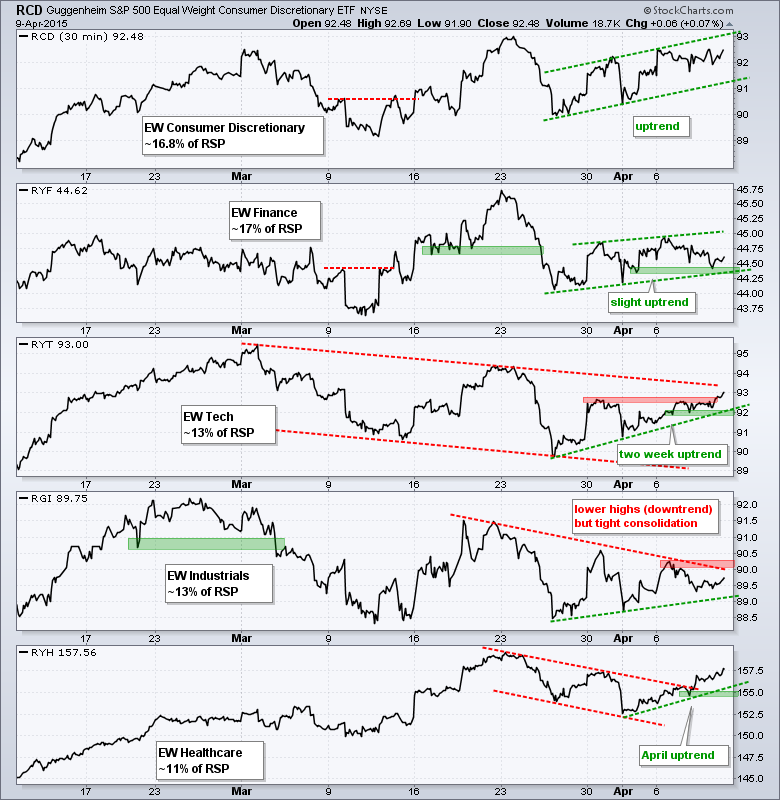
At some point a one to two week upswing turns into a short-term uptrend. Picking that point, however, is the tricky part. Looking at the five big sector charts, four are in upswings over the last 1-3 weeks. Three of these look like short-term uptrends: Equal-Weight Consumer Discretionary ETF (RCD), Equal-weight Finance ETF (RYF) and Equal-weight Technology ETF (RYT). The uptrend in RYF, however, looks the weakest and I am watching support at 44.25 closely. RYT and the Equal-weight Healthcare ETF (RYH) exceeded their late March highs. The Equal-weight Industrials ETF (RGI) is the weakest of the group because it remains below its early April high. All told, four of the five are in short-term uptrends and bullish overall.
**************************************************************
**************************************************************
**************************************************************
**************************************************************
**************************************************************
**************************************************************
**************************************************************
***************************************************************
Key Reports and Events (all times Eastern):
Thu - Apr 09 - 08:30 - Initial Jobless Claims
Thu - Apr 09 - 10:30 - Natural Gas Inventories
Tue - Apr 14 - 08:30 - Retail Sales
Tue - Apr 14 - 08:30 - Producer Price Index (PPI)
Wed - Apr 15 - 07:00 - MBA Mortgage Index
Wed - Apr 15 - 08:30 - Empire State Manufacturing
Wed - Apr 15 - 09:15 - Industrial Production
Wed - Apr 15 - 10:00 - NAHB Housing Market Index
Wed - Apr 15 - 10:30 - Oil Inventories
Wed - Apr 15 - 14:00 - Fed's Beige Book
Thu - Apr 16 - 08:30 - Initial Jobless Claims
Thu - Apr 16 - 08:30 - Housing Starts & Building Permits
Thu - Apr 16 - 10:00 - Philadelphia Fed
Thu - Apr 16 - 10:30 - Natural Gas Inventories
Fri - Apr 17 - 08:30 - Consumer Price Index (CPI)
Fri - Apr 17 - 10:00 - Michigan Sentiment
Fri - Apr 17 - 10:00 - Leading Economic Indicators
Wed - Apr 22 - 07:00 - MBA Mortgage Index
Wed - Apr 22 - 09:00 - FHFA Housing Price Index
Wed - Apr 22 - 10:00 - Existing Home Sales
Wed - Apr 22 - 10:30 - Oil Inventories
Thu - Apr 23 - 08:30 - Initial Jobless Claims
Thu - Apr 23 - 10:00 - New Home Sales
Thu - Apr 23 - 10:30 - Natural Gas Inventories
Fri - Apr 24 - 08:30 - Durable Goods Orders
Tue - Apr 28 - 09:00 - Case-Shiller Housing Index
Tue - Apr 28 - 10:00 - Consumer Confidence
Wed - Apr 29 - 07:00 - MBA Mortgage Purchase Index
Wed - Apr 29 - 10:00 - Pending Home Sales
Wed - Apr 29 - 10:30 - Oil Inventories
Wed - Apr 29 - 14:00 - FOMC Rate Decision
Thu - Apr 30 - 08:30 - Initial Jobless Claims
Thu - Apr 30 - 08:30 - PCE Prices
Thu - Apr 30 - 08:30 - Personal Income & Personal Spending
Thu - Apr 30 - 09:45 - Chicago PMI
Thu - Apr 30 - 10:30 - Natural Gas Inventories
Fri - May 01 - 08:15 - ADP Employment Report
Fri - May 01 - 10:00 - Construction Spending
Fri - May 01 - 10:00 - ISM Manufacturing Index
Fri - May 01 - 10:00 - Michigan Sentiment
Fri - May 01 - 17:00 - Auto-Truck Sales
This commentary is designed to stimulate thinking. This analysis is not a recommendation to buy, sell, hold or sell short any security (stock ETF or otherwise). We all need to think for ourselves when it comes to trading our own accounts. First, it is the only way to really learn. Second, we are the only ones responsible for our decisions. Think of these charts as food for further analysis. Before making a trade, it is important to have a plan. Plan the trade and trade the plan. Among other things, this includes setting a trigger level, a target area and a stop-loss level. It is also important to plan for three possible price movements: advance, decline or sideways. Have a plan for all three scenarios BEFORE making the trade. Consider possible holding times. And finally, look at overall market conditions and sector/industry performance.


