Stocks drifted on Tuesday with a slight downward bias as IWM and SPY closed fractionally lower. QQQ bucked the selling pressure with a modest gain. The sectors were mixed. The healthcare sector led the gainers, while the energy sector led the losers. The consumer discretionary sector finished with a small gain due to strength in the Home Construction iShares (ITB) and Retail SPDR (XRT). The Networking iShares (IGN) and Cloud Computing ETF (SKYY) lifted the technology sector. Weakness in oil weighed on the Oil & Gas Equip & Services SPDR (XES), which lost over 2%.
**This chart analysis is for educational purposes only, and should not
be construed as a recommendation to buy, sell or sell-short said securities**
Short-term Overview (Wednesday, 22-April-2015):
- Short-term breadth indicators remain bullish.
- The sectors are mixed with two flat, two down and one up (healthcare).
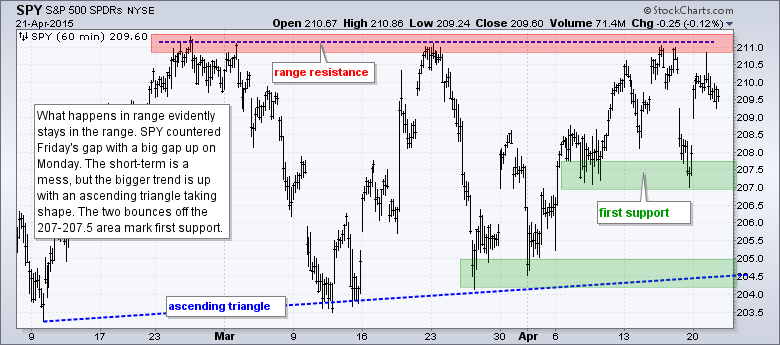
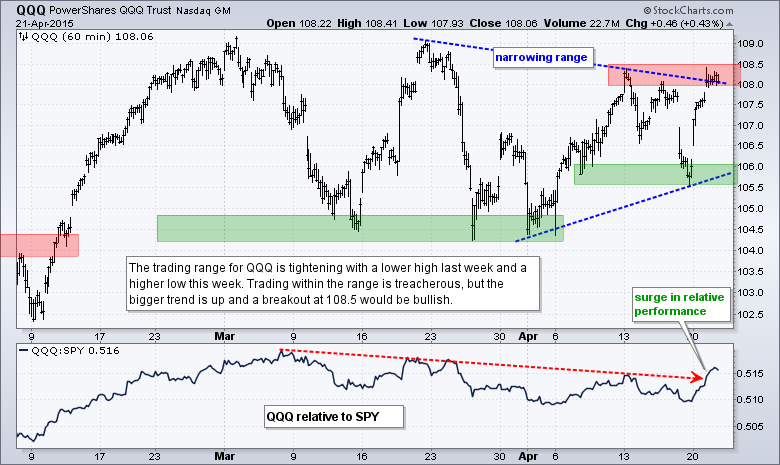
- SPY and QQQ gapped up on Monday and held their gaps, but remain within larger trading ranges.
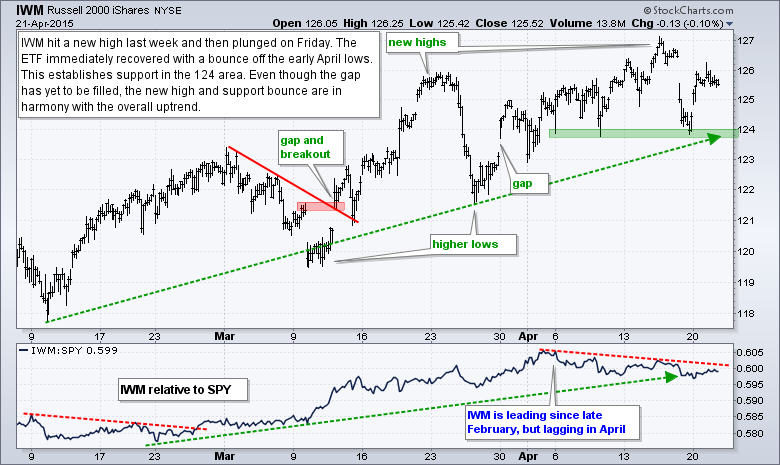
- IWM surged off the April lows and remains in an uptrend overall.
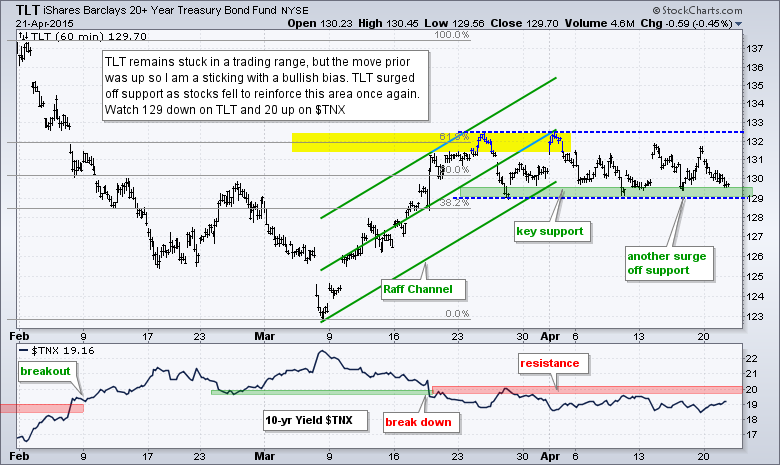
- TLT is back near consolidation support, which holds the key to the uptrend.
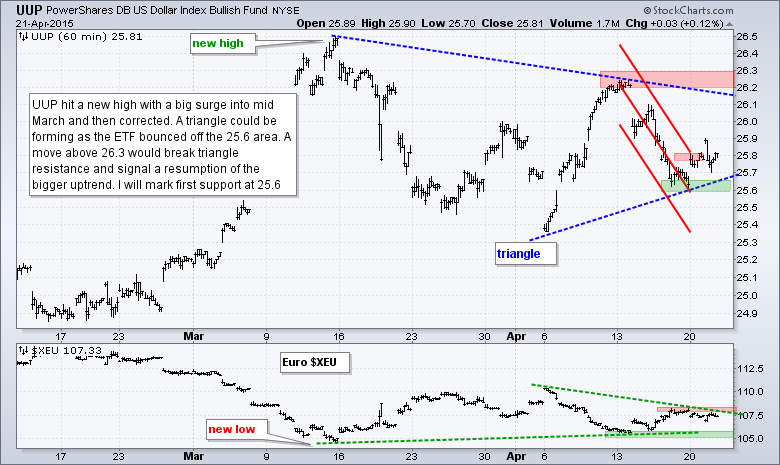
- UUP could be forming a triangle within a bigger uptrend.
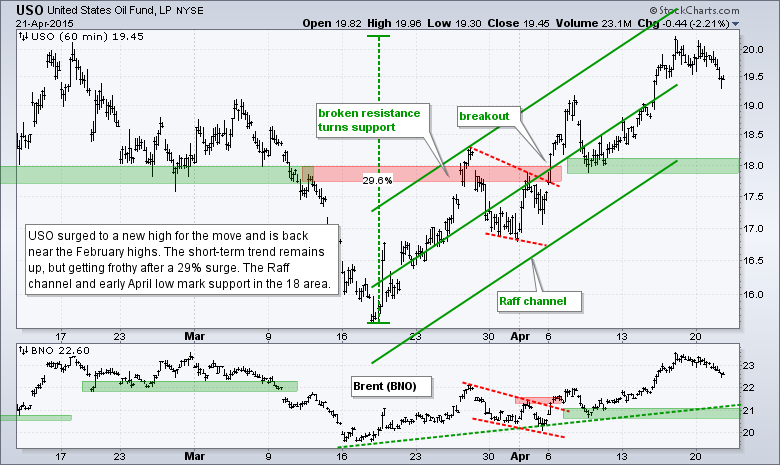
- USO remains in a short-term uptrend, but very overbought.
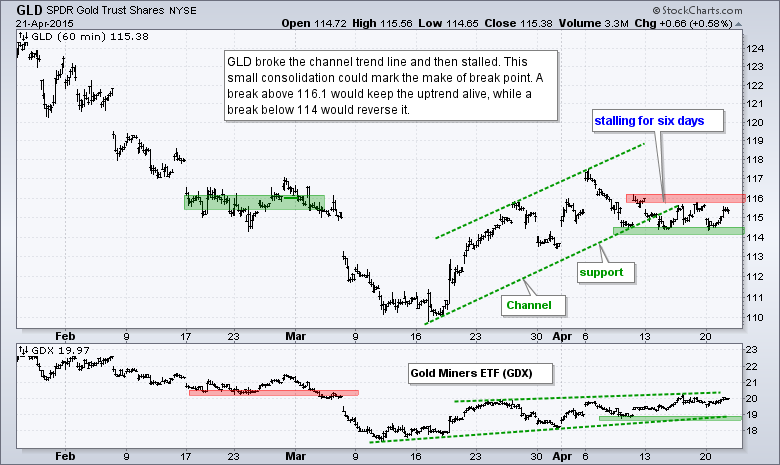
- GLD extended its consolidation and could be at a make-or-break point.
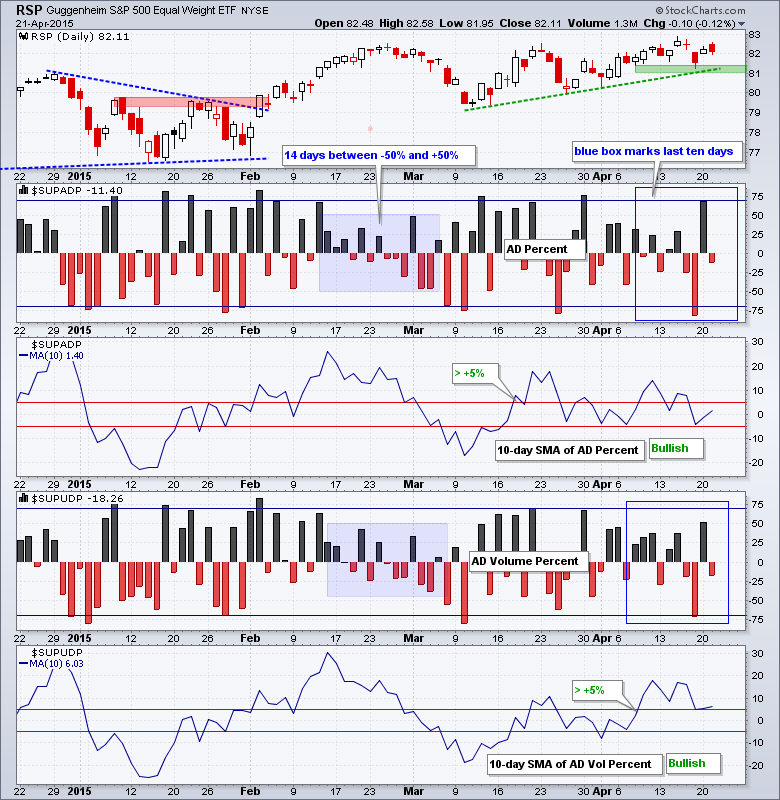
The Equal-Weight S&P 500 ETF (RSP) fell back with a fractional loss on Tuesday but remains in an uptrend with support at 81. AD Percent and AD Volume Percent finished slightly negative because selling pressure was not that strong. The 10-day SMA for AD Percent moved back into positive territory and remains in bull mode. The 10-day SMA for AD Volume Percent is above 5% and reflects strength in large-caps over the last ten days.
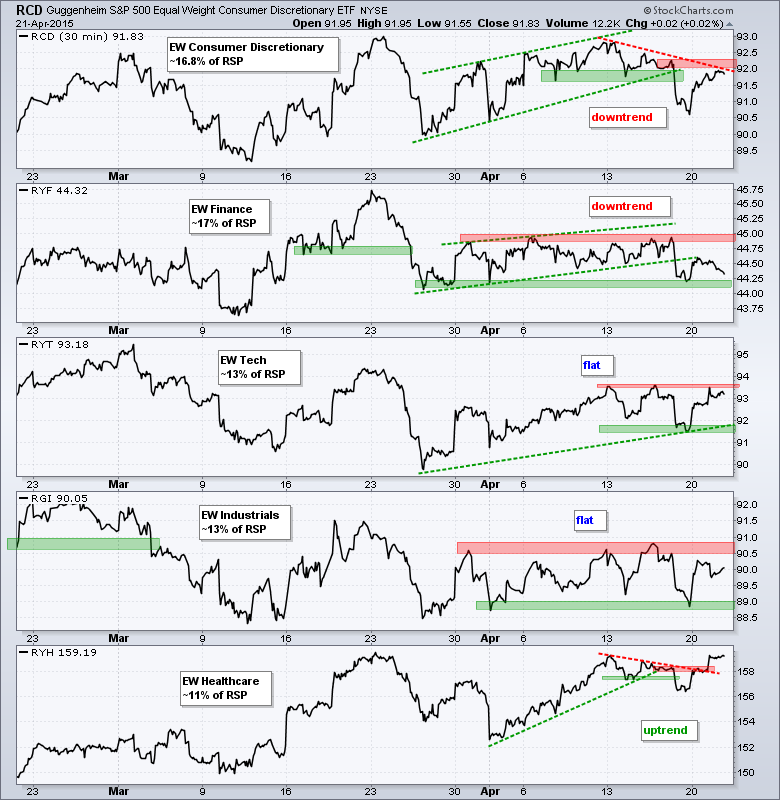
Two sectors are in downtrends, two are flat and one is in an uptrend. Yep, it is a mixed up market right now. The Equal-Weight Consumer Discretionary ETF (RCD) and the Equal-weight Finance ETF (RYF) are the weakest of the five. The Equal-weight Technology ETF (RYT) surged back to last week's highs and the Equal-weight Industrials ETF (RGI) got a big bounce off the early April low. Both are classified as flat pending breakouts. The Equal-weight Healthcare ETF (RYH) broke out to end its pullback and resume its uptrend.
**************************************************************
**************************************************************
**************************************************************
**************************************************************
**************************************************************
**************************************************************
**************************************************************
***************************************************************
Key Reports and Events (all times Eastern):
Wed - Apr 22 - 07:00 - MBA Mortgage Index
Wed - Apr 22 - 09:00 - FHFA Housing Price Index
Wed - Apr 22 - 10:00 - Existing Home Sales
Wed - Apr 22 - 10:30 - Oil Inventories
Thu - Apr 23 - 08:30 - Initial Jobless Claims
Thu - Apr 23 - 10:00 - New Home Sales
Thu - Apr 23 - 10:30 - Natural Gas Inventories
Fri - Apr 24 - 08:30 - Durable Goods Orders
Tue - Apr 28 - 09:00 - Case-Shiller Housing Index
Tue - Apr 28 - 10:00 - Consumer Confidence
Wed - Apr 29 - 07:00 - MBA Mortgage Purchase Index
Wed - Apr 29 - 10:00 - Pending Home Sales
Wed - Apr 29 - 10:30 - Oil Inventories
Wed - Apr 29 - 14:00 - FOMC Rate Decision
Thu - Apr 30 - 08:30 - Initial Jobless Claims
Thu - Apr 30 - 08:30 - PCE Prices
Thu - Apr 30 - 08:30 - Personal Income & Personal Spending
Thu - Apr 30 - 09:45 - Chicago PMI
Thu - Apr 30 - 10:30 - Natural Gas Inventories
Fri - May 01 - 08:15 - ADP Employment Report
Fri - May 01 - 10:00 - Construction Spending
Fri - May 01 - 10:00 - ISM Manufacturing Index
Fri - May 01 - 10:00 - Michigan Sentiment
Fri - May 01 - 17:00 - Auto-Truck Sales
This commentary is designed to stimulate thinking. This analysis is not a recommendation to buy, sell, hold or sell short any security (stock ETF or otherwise). We all need to think for ourselves when it comes to trading our own accounts. First, it is the only way to really learn. Second, we are the only ones responsible for our decisions. Think of these charts as food for further analysis. Before making a trade, it is important to have a plan. Plan the trade and trade the plan. Among other things, this includes setting a trigger level, a target area and a stop-loss level. It is also important to plan for three possible price movements: advance, decline or sideways. Have a plan for all three scenarios BEFORE making the trade. Consider possible holding times. And finally, look at overall market conditions and sector/industry performance.


