Stocks dipped on the open, but quickly caught a bid and moved higher for most of the day. The final gains, however, were modest as QQQ, IWM, SPY and DIA gained around a half percent. The Finance SPDR and the Technology SPDR led the way higher. The consumer discretionary sector was weighed down by weakness in the Home Construction iShares (-1.5%). Precious metals were weak and the Gold Miners ETF fell over 3%.
**This chart analysis is for educational purposes only, and should not
be construed as a recommendation to buy, sell or sell-short said securities**
Short-term Overview (Thursday, 23-April-2015):
- Short-term breadth indicators remain bullish.
- The sectors are mixed with two up, two down and one flat.
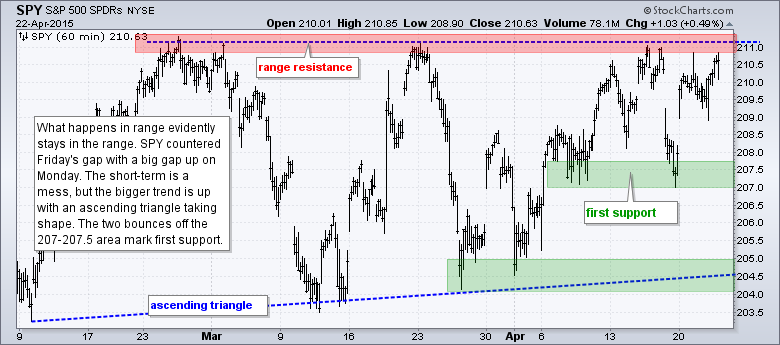
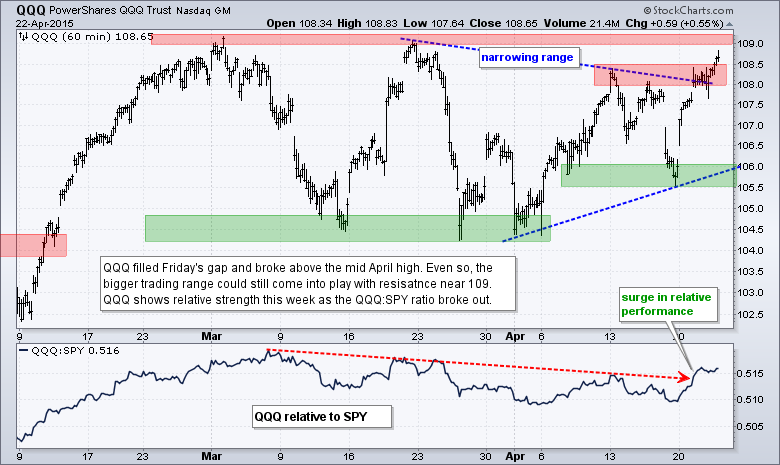
- SPY and QQQ gapped up on Monday and held their gaps, but remain within larger trading ranges.
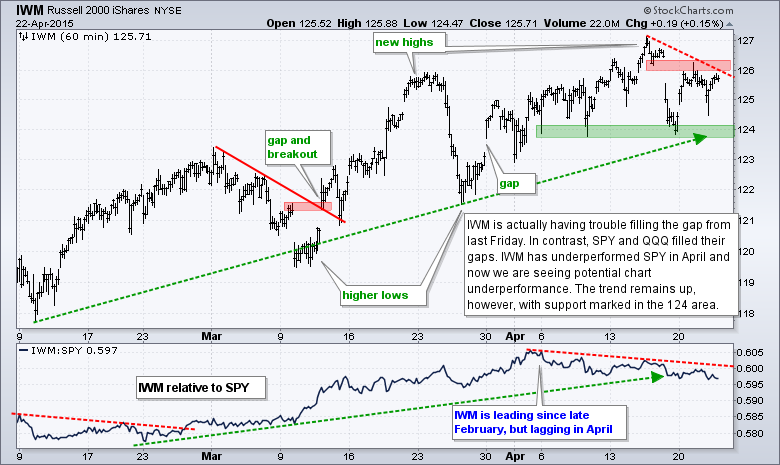
- IWM remains in an overall uptrend, but is having trouble filling Friday's gap.
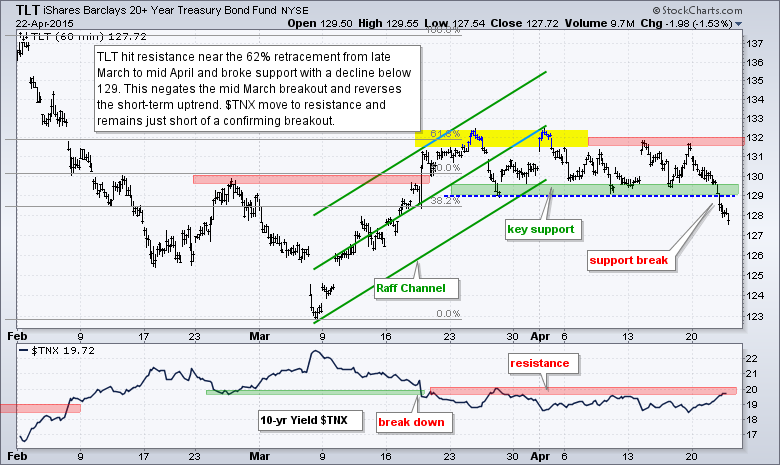
- TLT broke consolidation support to reverse its uptrend.
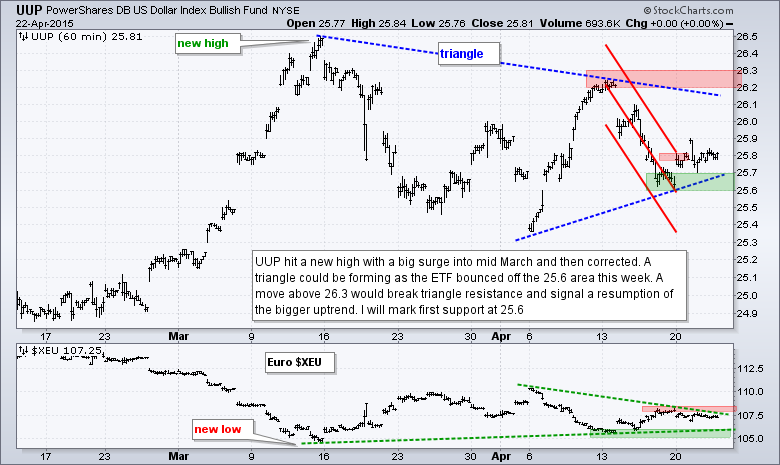
- UUP could be forming a triangle within a bigger uptrend.
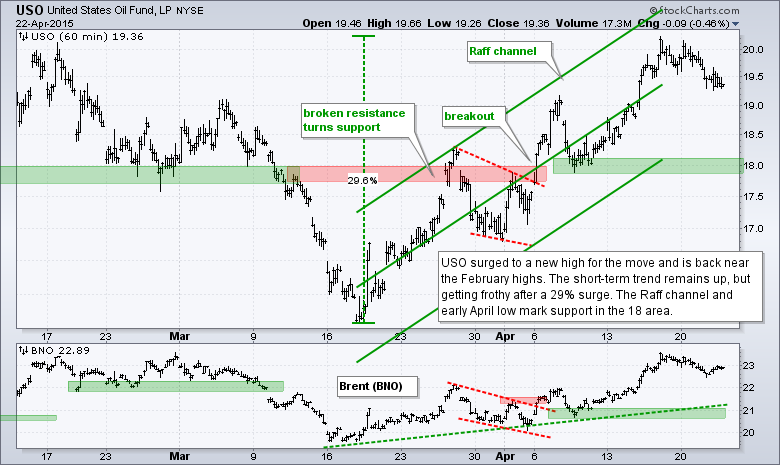
- USO remains in a short-term uptrend, but very overbought.
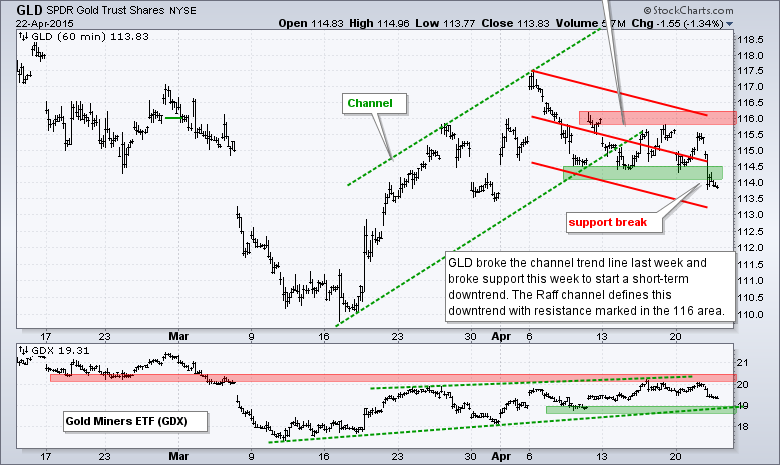
- GLD broke consolidation support and is now in a short-term downtrend.
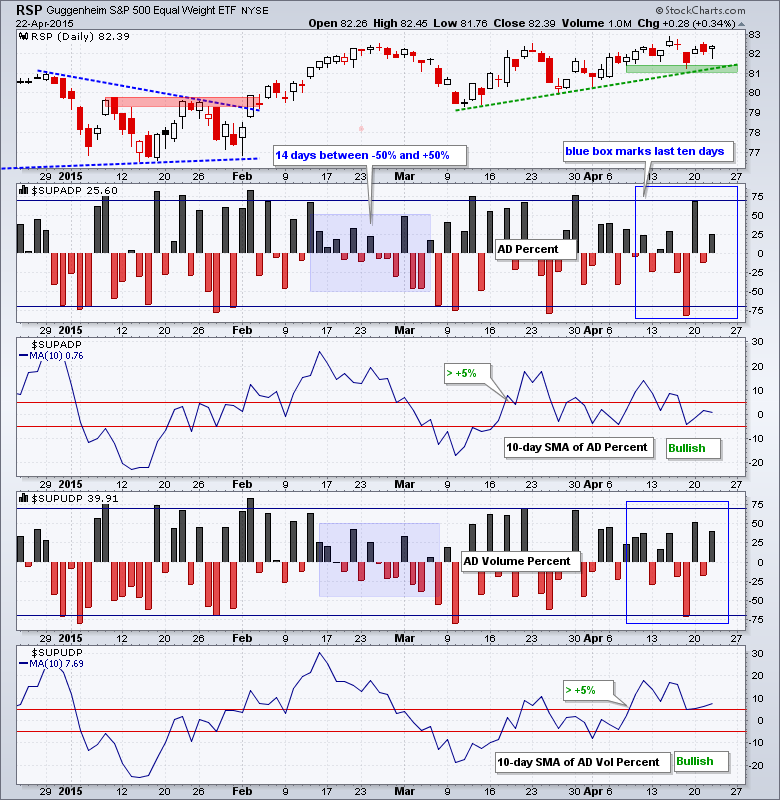
The Equal-Weight S&P 500 ETF (RSP) dipped below 82 during the day, but recovered and closed with a small gain to keep the uptrend alive. It is a slow and choppy affair with support marked at 81. AD Percent and AD Volume Percent finished modestly positive (below +50%). The 10-day SMA for AD Percent has been bullish since the cross above +5% on March 18th and will remain bullish until a cross below -5%. The 10-day SMA for AD Volume Percent is also bullish and is above +7%.
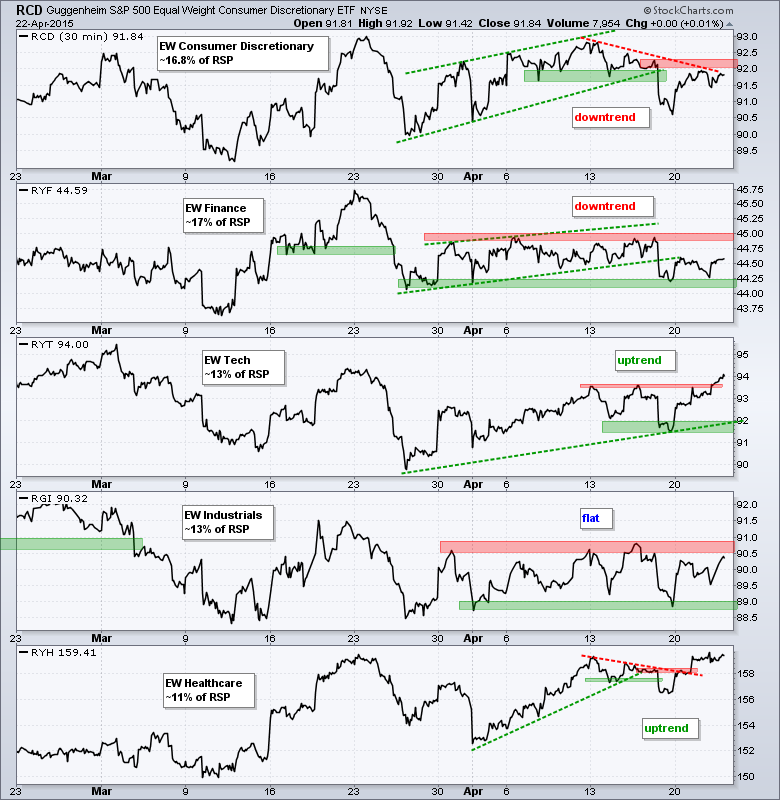
The short-term trends for the five big sectors remain mixed. The Equal-Weight Consumer Discretionary ETF (RCD) and Equal-weight Finance ETF (RYF) are in downtrends. Well, one could call the RYF trend flat, but we need a breakout at 45 to turn bullish. The Equal-weight Technology ETF (RYT) broke out to join the Equal-weight Healthcare ETF (RYH) in an uptrend. That makes two up and two down. The Equal-weight Industrials ETF (RGI) could break the tie, but it remains in a trading range.
**************************************************************
**************************************************************
**************************************************************
**************************************************************
**************************************************************
**************************************************************
**************************************************************
***************************************************************
Key Reports and Events (all times Eastern):
Thu - Apr 23 - 08:30 - Initial Jobless Claims
Thu - Apr 23 - 10:00 - New Home Sales
Thu - Apr 23 - 10:30 - Natural Gas Inventories
Fri - Apr 24 - 08:30 - Durable Goods Orders
Tue - Apr 28 - 09:00 - Case-Shiller Housing Index
Tue - Apr 28 - 10:00 - Consumer Confidence
Wed - Apr 29 - 07:00 - MBA Mortgage Purchase Index
Wed - Apr 29 - 10:00 - Pending Home Sales
Wed - Apr 29 - 10:30 - Oil Inventories
Wed - Apr 29 - 14:00 - FOMC Rate Decision
Thu - Apr 30 - 08:30 - Initial Jobless Claims
Thu - Apr 30 - 08:30 - PCE Prices
Thu - Apr 30 - 08:30 - Personal Income & Personal Spending
Thu - Apr 30 - 09:45 - Chicago PMI
Thu - Apr 30 - 10:30 - Natural Gas Inventories
Fri - May 01 - 08:15 - ADP Employment Report
Fri - May 01 - 10:00 - Construction Spending
Fri - May 01 - 10:00 - ISM Manufacturing Index
Fri - May 01 - 10:00 - Michigan Sentiment
Fri - May 01 - 17:00 - Auto-Truck Sales
This commentary is designed to stimulate thinking. This analysis is not a recommendation to buy, sell, hold or sell short any security (stock ETF or otherwise). We all need to think for ourselves when it comes to trading our own accounts. First, it is the only way to really learn. Second, we are the only ones responsible for our decisions. Think of these charts as food for further analysis. Before making a trade, it is important to have a plan. Plan the trade and trade the plan. Among other things, this includes setting a trigger level, a target area and a stop-loss level. It is also important to plan for three possible price movements: advance, decline or sideways. Have a plan for all three scenarios BEFORE making the trade. Consider possible holding times. And finally, look at overall market conditions and sector/industry performance.


