Stocks meandered from Monday to Thursday and then got pummeled on Friday. There were two bouts of selling pressure that lasted less than two hours in total. The S&P 500 declined sharply on the open (45 minutes), firmed and then fell another ten points in the early afternoon (one hour). Buyers stepped to the plate in the final hour and pushed the S&P 500 off its lows. Selling pressure was pretty much across the board with all sectors losing ground. Utilities held up the best as the 20+ YR T-Bond ETF (TLT) surged and the 10-YR Treasury Yield ($TNX) fell. The REIT iShares (IYR) also held up relatively well. Gold and platinum caught safe-haven bids as the Dollar fell.
**This chart analysis is for educational purposes only, and should not
be construed as a recommendation to buy, sell or sell-short said securities**
Short-term Overview (Monday, 20-April-2015):
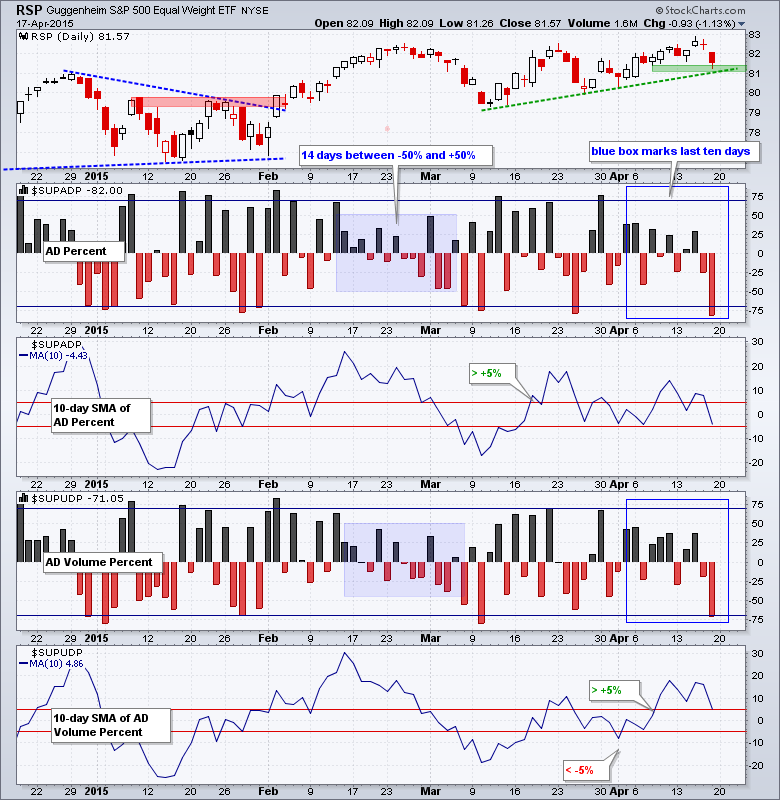
- Breadth plunged on Friday, but the short-term indicators are bullish overall.
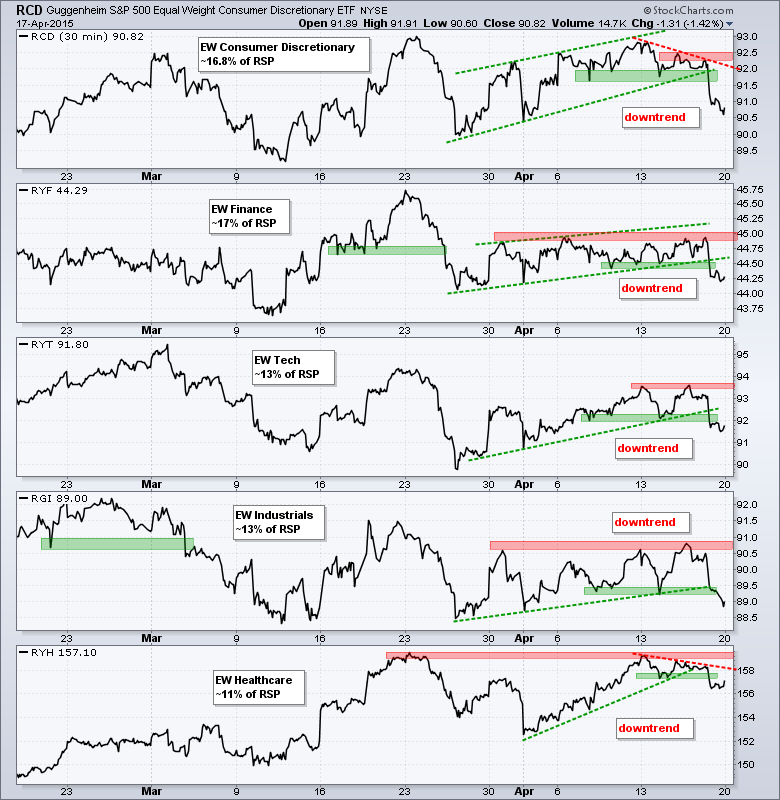
- All five big sectors are in short-term downtrends.
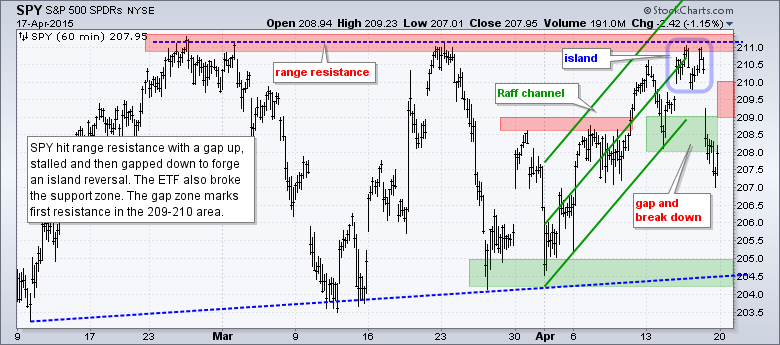
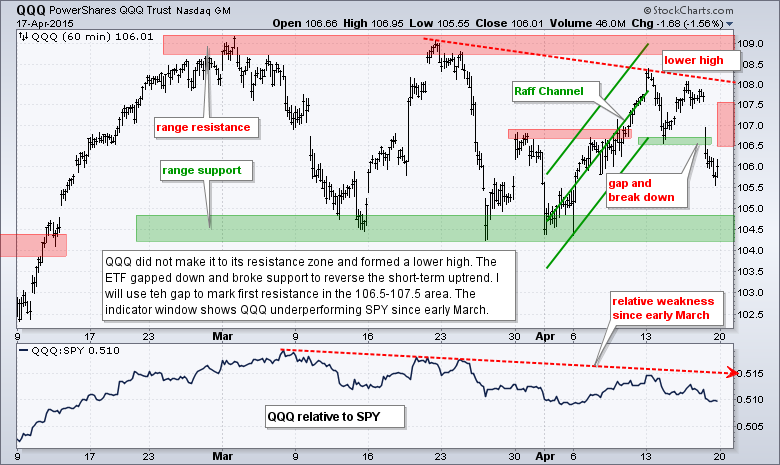
- SPY and QQQ reversed their upswings with gap and sharp declines.
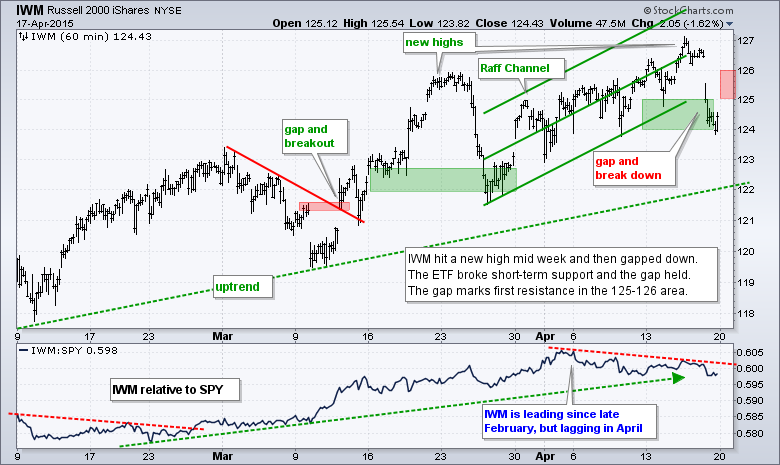
- IWM reversed its upswing with a gap and sharp decline.
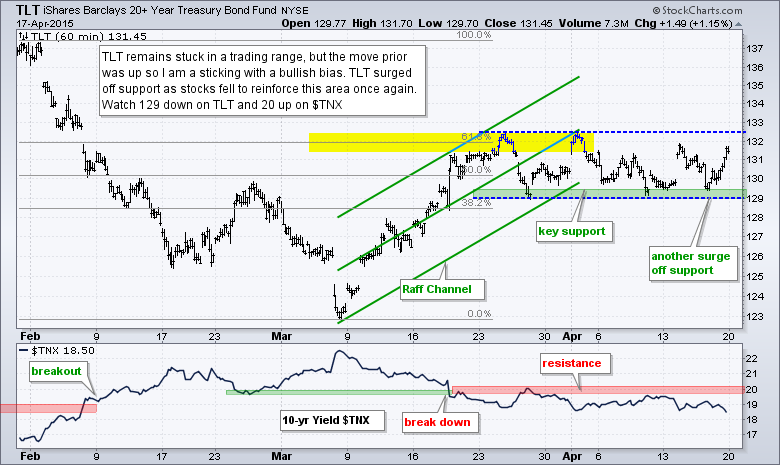
- TLT surged off consolidation support to hold its uptrend.
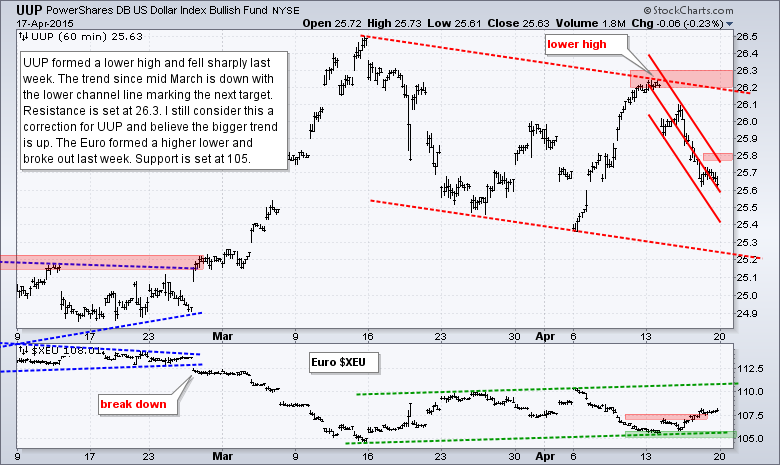
- UUP is in a short-term downtrend after a sharp decline last week.
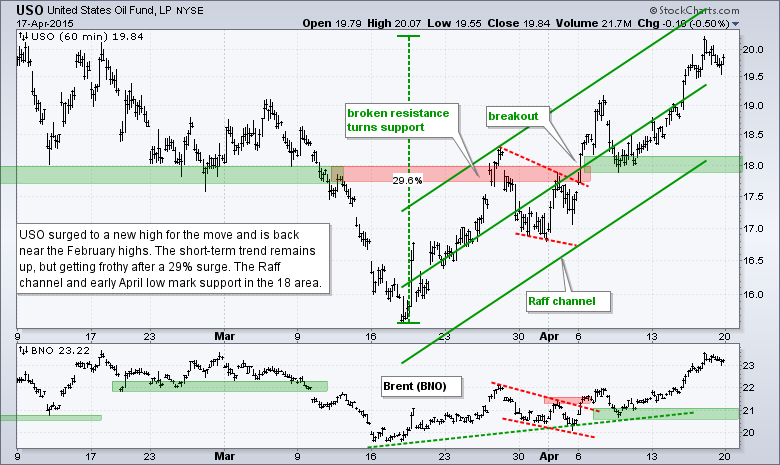
- USO remains in a short-term uptrend, but is getting overbought.
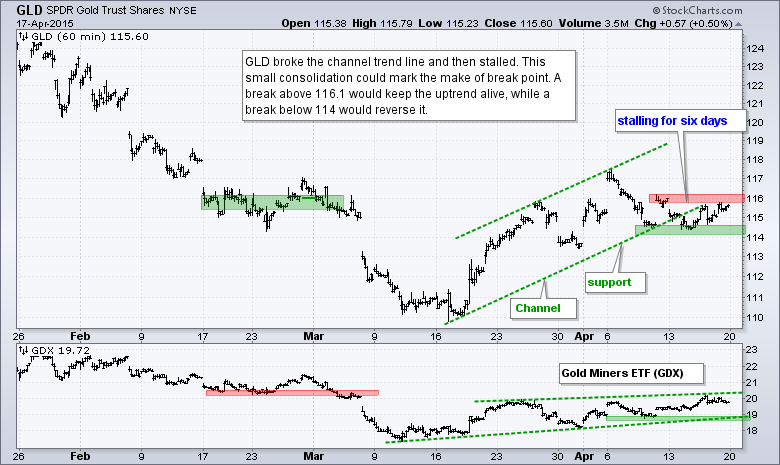
- GLD extended its consolidation and could be at a make-or-break point.
The Equal-Weight S&P 500 ETF (RSP) gapped down and tested the support zone on Friday. This gap is negative, but the short-term trend appears to be up still. AD Percent and AD Volume Percent both plunged below -70% for the first decisive day in April. Even so, the 10-day SMA for AD Percent has yet to trigger a bearish signal with a move below -5% and the 10-day SMA for AD Volume Percent remains in positive territory. Overall, short-term breadth is still bullish.
All five equal-weight sector ETFs broke short-term support and finished near their lows for the week. The Equal-Weight Consumer Discretionary ETF (RCD) formed a lower high and led the way lower. The Equal-weight Finance ETF (RYF) stalled in April and broke down last week. The Equal-weight Technology ETF (RYT) and Equal-weight Industrials ETF (RGI) actually hit higher highs last week, but reversed sharply and broke support.
**************************************************************
**************************************************************
**************************************************************
**************************************************************
**************************************************************
**************************************************************
**************************************************************
***************************************************************
Key Reports and Events (all times Eastern):
Wed - Apr 22 - 07:00 - MBA Mortgage Index
Wed - Apr 22 - 09:00 - FHFA Housing Price Index
Wed - Apr 22 - 10:00 - Existing Home Sales
Wed - Apr 22 - 10:30 - Oil Inventories
Thu - Apr 23 - 08:30 - Initial Jobless Claims
Thu - Apr 23 - 10:00 - New Home Sales
Thu - Apr 23 - 10:30 - Natural Gas Inventories
Fri - Apr 24 - 08:30 - Durable Goods Orders
Tue - Apr 28 - 09:00 - Case-Shiller Housing Index
Tue - Apr 28 - 10:00 - Consumer Confidence
Wed - Apr 29 - 07:00 - MBA Mortgage Purchase Index
Wed - Apr 29 - 10:00 - Pending Home Sales
Wed - Apr 29 - 10:30 - Oil Inventories
Wed - Apr 29 - 14:00 - FOMC Rate Decision
Thu - Apr 30 - 08:30 - Initial Jobless Claims
Thu - Apr 30 - 08:30 - PCE Prices
Thu - Apr 30 - 08:30 - Personal Income & Personal Spending
Thu - Apr 30 - 09:45 - Chicago PMI
Thu - Apr 30 - 10:30 - Natural Gas Inventories
Fri - May 01 - 08:15 - ADP Employment Report
Fri - May 01 - 10:00 - Construction Spending
Fri - May 01 - 10:00 - ISM Manufacturing Index
Fri - May 01 - 10:00 - Michigan Sentiment
Fri - May 01 - 17:00 - Auto-Truck Sales
This commentary is designed to stimulate thinking. This analysis is not a recommendation to buy, sell, hold or sell short any security (stock ETF or otherwise). We all need to think for ourselves when it comes to trading our own accounts. First, it is the only way to really learn. Second, we are the only ones responsible for our decisions. Think of these charts as food for further analysis. Before making a trade, it is important to have a plan. Plan the trade and trade the plan. Among other things, this includes setting a trigger level, a target area and a stop-loss level. It is also important to plan for three possible price movements: advance, decline or sideways. Have a plan for all three scenarios BEFORE making the trade. Consider possible holding times. And finally, look at overall market conditions and sector/industry performance.


