Stocks meandered on Thursday as the S&P 500 started negative, moved into positive territory and then finished slightly negative. The major index ETFs ended mixed with fractional gains in DIA and the Russell MicroCap iShares (IWC), but fractional losses in QQQ and IWM. The sectors were also mixed with finance, consumer staples and consumer discretionary producing small gains. The Utilities SPDR (XLU) led the sector SPDRs lower with a .65% loss. Housing stocks weighed on the consumer discretionary sector as the Home Construction iShares (ITB) fell 1.85%.
**This chart analysis is for educational purposes only, and should not
be construed as a recommendation to buy, sell or sell-short said securities**
Short-term Overview (Friday, 17-April-2015):
- Breadth is uninspiring, but bullish overall.
- All five big sectors are in short-term uptrends.
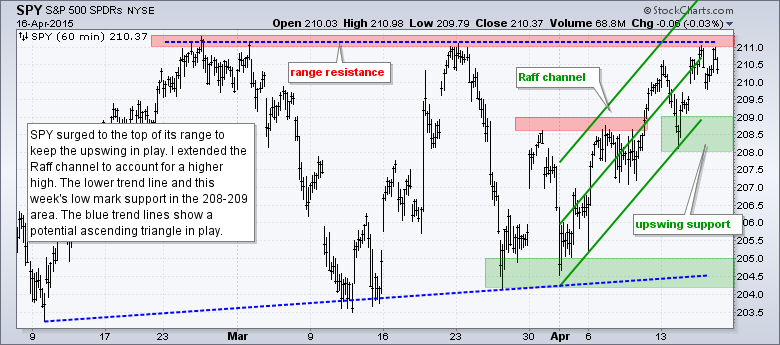
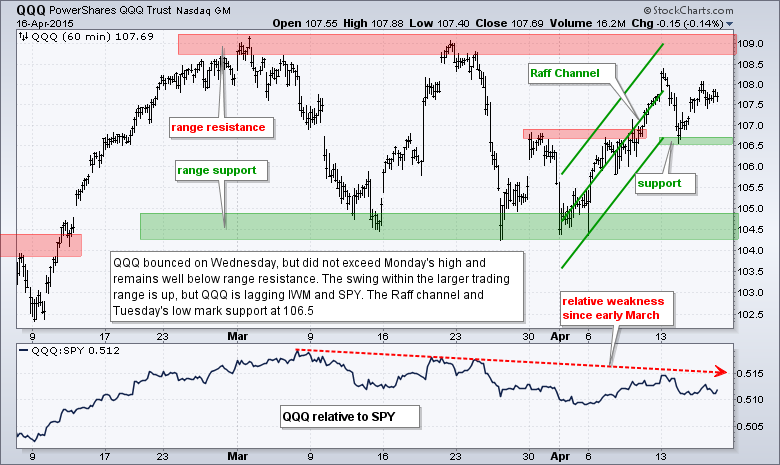
- SPY and QQQ are in upswings within trading ranges.
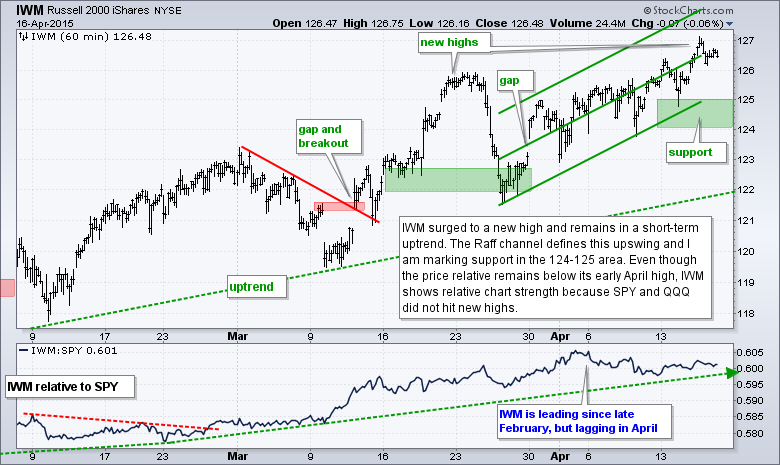
- IWM remains in an uptrend and hit a new high on Wednesday.
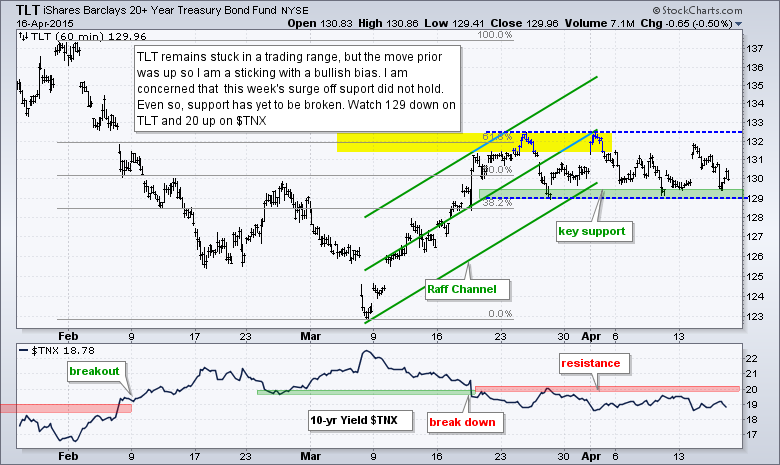
- TLT continues to test support and hold its uptrend.
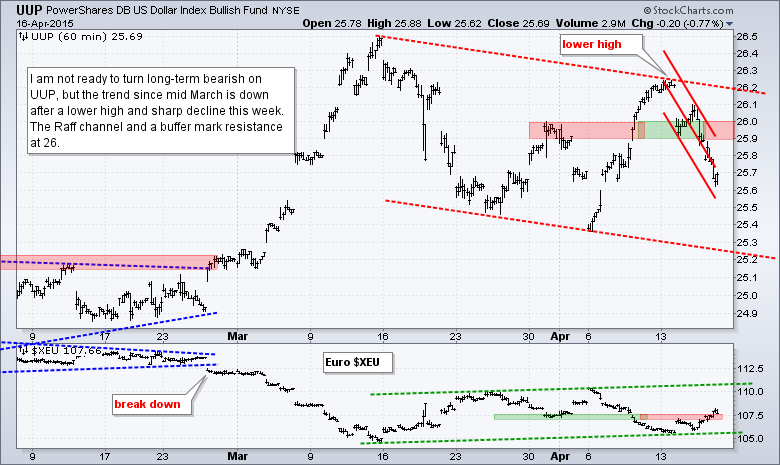
- UUP formed a lower high, turned down this week to start a short-term downtrend.
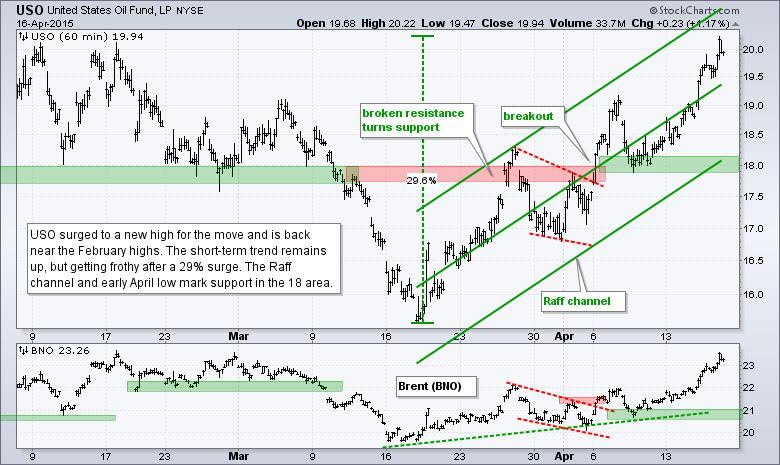
- USO remains in a short-term uptrend, but is getting overbought.
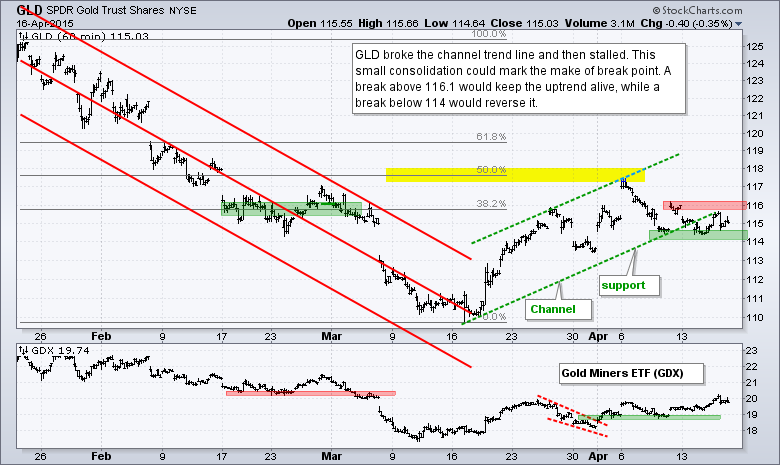
- GLD is testing uptrend support.
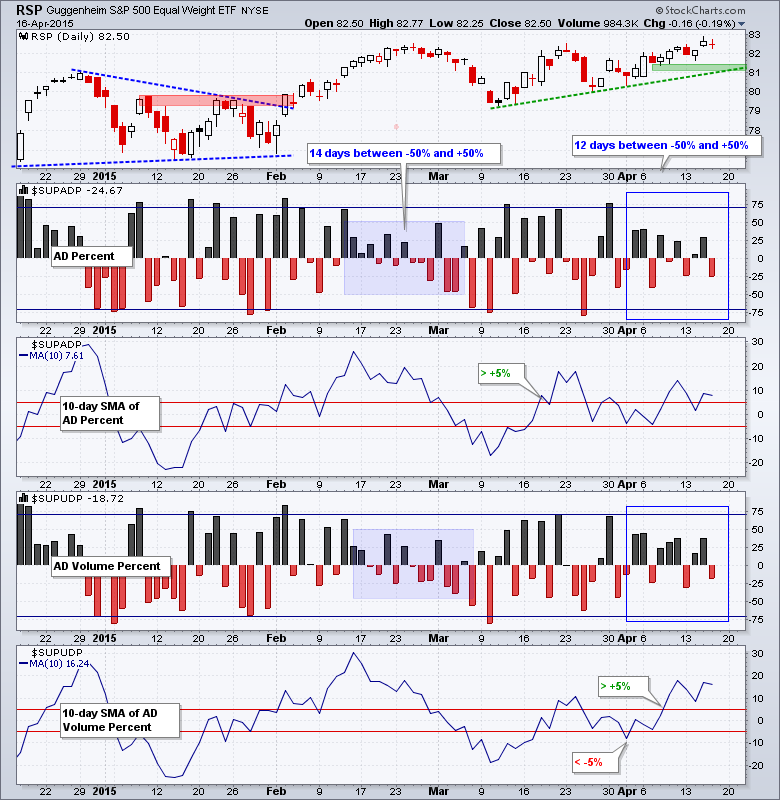
The Equal-Weight S&P 500 ETF (RSP) stalled with a doji and small decline. Nevertheless, the short-term trend here is clearly up and support remains at 81. AD Percent (-25%) and AD Volume Percent (-19%) finished slightly negative, and extended their streak between -50% and +50%. It is a boring uptrend, but the 10-day SMAs for AD Percent and AD Volume Percent are in positive territory and bullish overall.
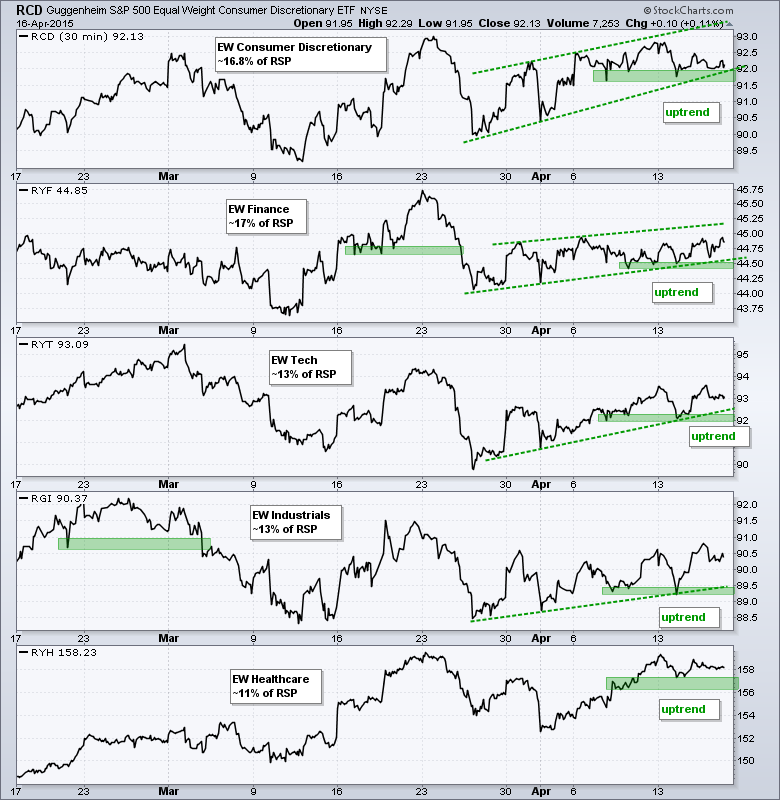
All five equal-weight sector ETFs are in short-term uptrends. The Equal-Weight Consumer Discretionary ETF (RCD) and Equal-weight Healthcare ETF (RYH) are dragging a bit this week because both remain below Monday's high.
**************************************************************
**************************************************************
**************************************************************
**************************************************************
**************************************************************
**************************************************************
**************************************************************
***************************************************************
Key Reports and Events (all times Eastern):
Fri - Apr 17 - 08:30 - Consumer Price Index (CPI)
Fri - Apr 17 - 10:00 - Michigan Sentiment
Fri - Apr 17 - 10:00 - Leading Economic Indicators
Wed - Apr 22 - 07:00 - MBA Mortgage Index
Wed - Apr 22 - 09:00 - FHFA Housing Price Index
Wed - Apr 22 - 10:00 - Existing Home Sales
Wed - Apr 22 - 10:30 - Oil Inventories
Thu - Apr 23 - 08:30 - Initial Jobless Claims
Thu - Apr 23 - 10:00 - New Home Sales
Thu - Apr 23 - 10:30 - Natural Gas Inventories
Fri - Apr 24 - 08:30 - Durable Goods Orders
Tue - Apr 28 - 09:00 - Case-Shiller Housing Index
Tue - Apr 28 - 10:00 - Consumer Confidence
Wed - Apr 29 - 07:00 - MBA Mortgage Purchase Index
Wed - Apr 29 - 10:00 - Pending Home Sales
Wed - Apr 29 - 10:30 - Oil Inventories
Wed - Apr 29 - 14:00 - FOMC Rate Decision
Thu - Apr 30 - 08:30 - Initial Jobless Claims
Thu - Apr 30 - 08:30 - PCE Prices
Thu - Apr 30 - 08:30 - Personal Income & Personal Spending
Thu - Apr 30 - 09:45 - Chicago PMI
Thu - Apr 30 - 10:30 - Natural Gas Inventories
Fri - May 01 - 08:15 - ADP Employment Report
Fri - May 01 - 10:00 - Construction Spending
Fri - May 01 - 10:00 - ISM Manufacturing Index
Fri - May 01 - 10:00 - Michigan Sentiment
Fri - May 01 - 17:00 - Auto-Truck Sales
This commentary is designed to stimulate thinking. This analysis is not a recommendation to buy, sell, hold or sell short any security (stock ETF or otherwise). We all need to think for ourselves when it comes to trading our own accounts. First, it is the only way to really learn. Second, we are the only ones responsible for our decisions. Think of these charts as food for further analysis. Before making a trade, it is important to have a plan. Plan the trade and trade the plan. Among other things, this includes setting a trigger level, a target area and a stop-loss level. It is also important to plan for three possible price movements: advance, decline or sideways. Have a plan for all three scenarios BEFORE making the trade. Consider possible holding times. And finally, look at overall market conditions and sector/industry performance.


