Stocks surged on Monday morning and plunged on Tuesday afternoon. The S&P 500 is still up over the last two days, but Tuesday's final hour sell off could foreshadow a tougher trading environment ahead. Small-caps and mid-caps led the selloff as IWM lost .64% and MDY declined .82%. Healthcare bucked the selling pressure and the technology sector held up relatively well. Note that the Cloud Computing ETF (SKYY), Internet ETF (FDN) and Networking iShares (IGN) finished with gains. The Biotech iShares (IBB) lifted the healthcare sector with a .91% gain.
**This chart analysis is for educational purposes only, and should not
be construed as a recommendation to buy, sell or sell-short said securities**
Short-term Overview (Wednesday, 8-April-2015):
- Short-term breadth is slightly bearish.
- Only two of the five big sectors are in short-term uptrends.
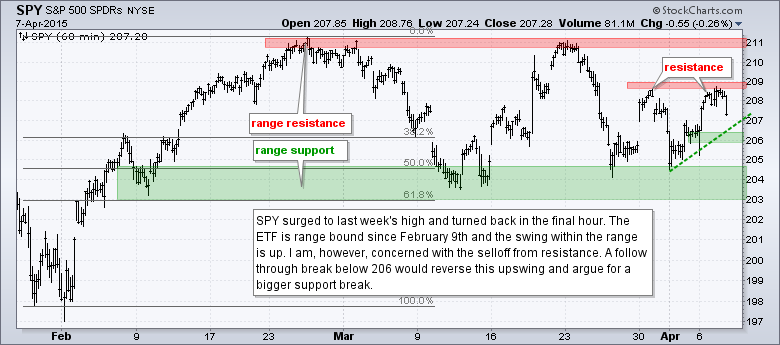
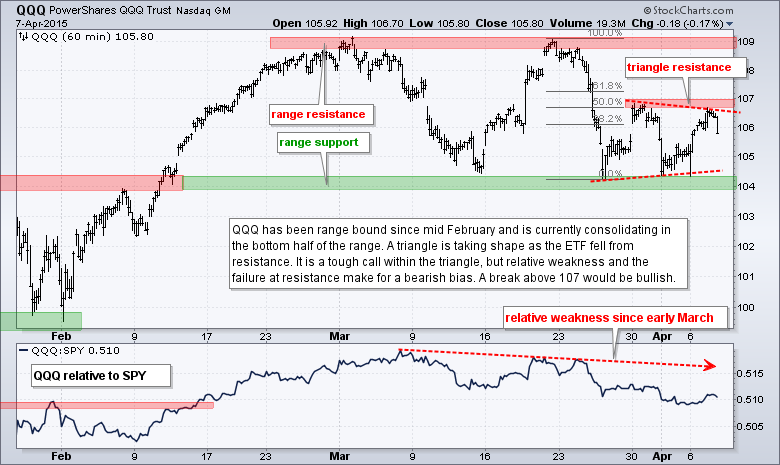
- SPY and QQQ are stuck in ranges.
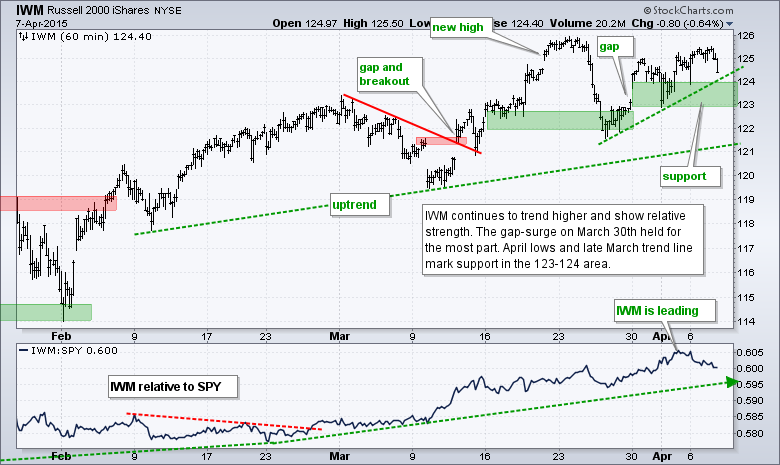
- IWM remains in an uptrend and shows relative strength.
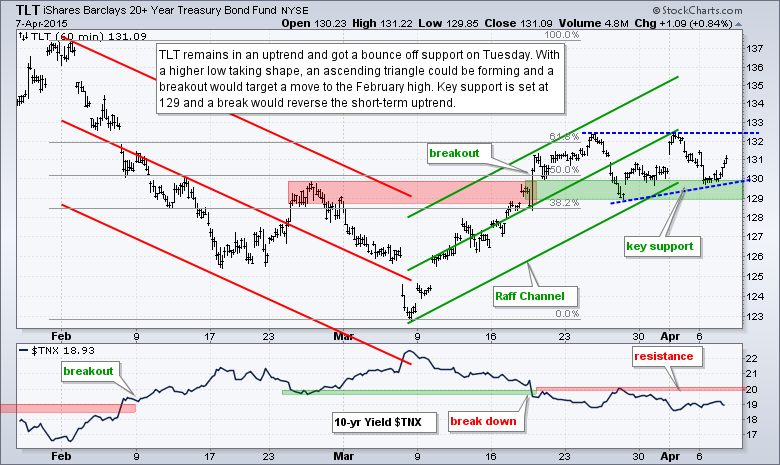
- TLT bounced off support and could be forming an ascending triangle.
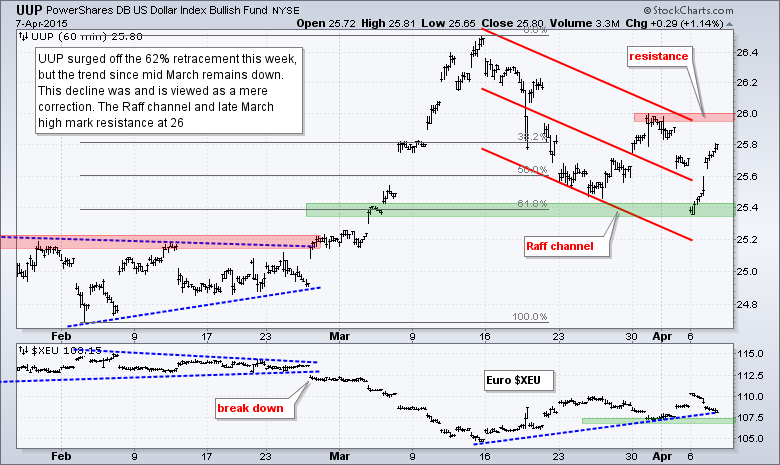
- UUP surged off the 62% retracement, but remains in a short-term downtrend.
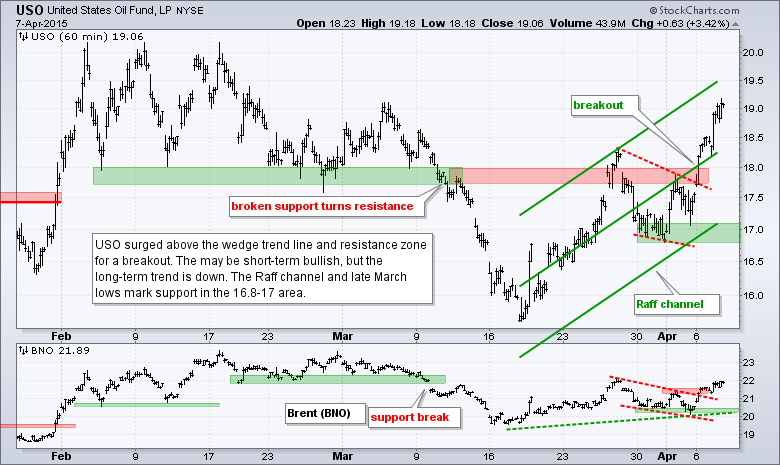
- USO broke wedge resistance with a surge on Monday.
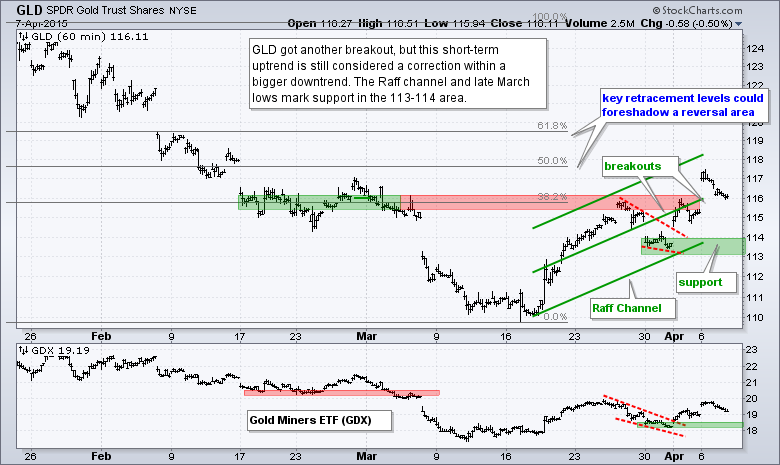
- GLD extended its short-term uptrend with a surge on Monday.
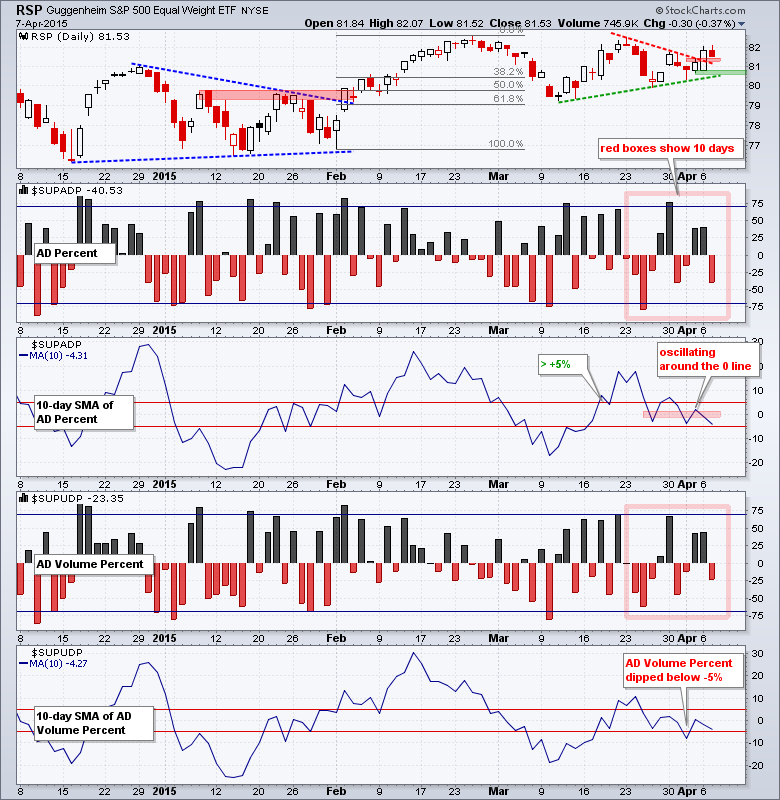
The Equal-Weight S&P 500 ETF (RSP) surged and fell back, but the little breakout is holding. Watch 80.5 for a support break. Breadth turned negative on Tuesday with S&P 1500 AD Percent ($SUPADP) dipping to -40% and S&P 1500 AD Volume Percent ($SUPUDP) hitting -23%. Selling pressure was not that intense, but buying pressure on the prior bounce also left something to be desired. The 10-day SMA for AD Percent is on the verge of breaking -5%, which would trigger a bearish signal. The 10-day SMA for AD Volume Percent broke -5% on April 1st and remains short-term bearish until a counter signal with a move above +5%. On balance, I would say that short-term breadth tilts slightly in favor of the bears.
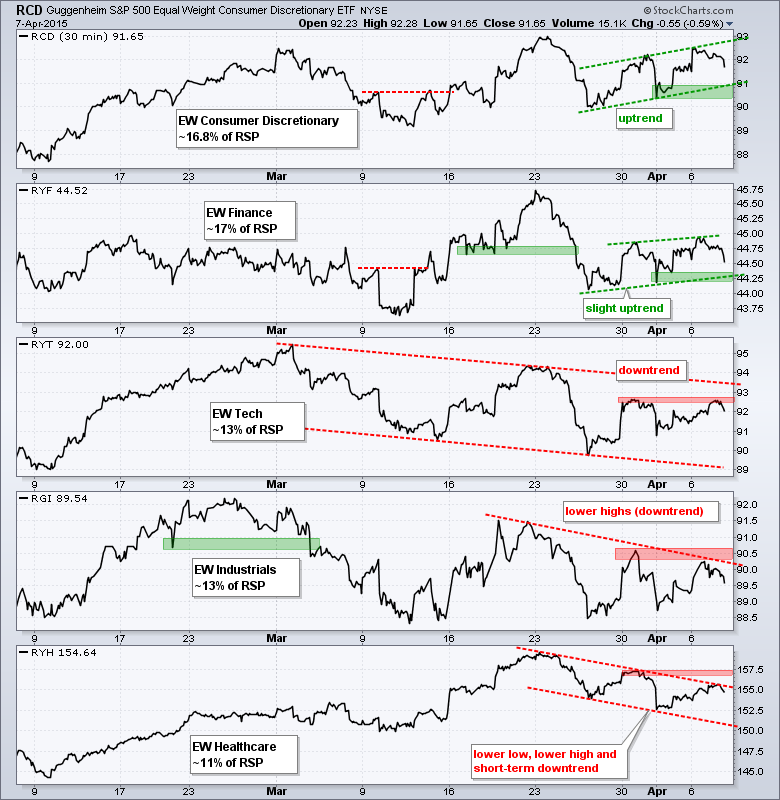
The sectors tilt towards the bearish with two in short-term uptrends and three in downtrends. The Equal-Weight Consumer Discretionary ETF (RCD) and Equal-weight Finance ETF (RYF) have higher highs and higher lows working since March 26th (uptrends). The April 1st lows mark support and a break would be bearish. The Equal-weight Technology ETF (RYT) and Equal-weight Industrials ETF (RGI) have been trending down for five weeks and neither exceeded their late March highs, which mark resistance zones. The Equal-weight Healthcare ETF (RYH) has been in a downtrend since March 23rd. Even though this decline looks like a correction within a bigger uptrend, it is a short-term downtrend until a breakout.
The short-term evidence remains mixed. Breadth tilts slightly towards the bears. SPY and QQQ were turned back near last week's highs, and QQQ shows relative weakness. IWM is still in an uptrend and showing relative strength. The sectors are mixed with RCD and RYF holding the market up right now. Earnings season gets underway today with Alcoa and there is lots of noise that this will be a bad quarter overall. Even so, the S&P 500 and Russell 2000 are less than 2% from their 52-week highs. Go figure.
**************************************************************
**************************************************************
**************************************************************
**************************************************************
**************************************************************
**************************************************************
***************************************************************
Key Reports and Events (all times Eastern):
Wed - Apr 08 - 07:00 - MBA Mortgage Index
Wed - Apr 08 - 10:30 - Oil Inventories
Wed - Apr 08 - 14:00 - FOMC Minutes
Thu - Apr 09 - 08:30 - Initial Jobless Claims
Thu - Apr 09 - 10:30 - Natural Gas Inventories
Tue - Apr 14 - 08:30 - Retail Sales
Tue - Apr 14 - 08:30 - Producer Price Index (PPI)
Wed - Apr 15 - 07:00 - MBA Mortgage Index
Wed - Apr 15 - 08:30 - Empire State Manufacturing
Wed - Apr 15 - 09:15 - Industrial Production
Wed - Apr 15 - 10:00 - NAHB Housing Market Index
Wed - Apr 15 - 10:30 - Oil Inventories
Wed - Apr 15 - 14:00 - Fed's Beige Book
Thu - Apr 16 - 08:30 - Initial Jobless Claims
Thu - Apr 16 - 08:30 - Housing Starts & Building Permits
Thu - Apr 16 - 10:00 - Philadelphia Fed
Thu - Apr 16 - 10:30 - Natural Gas Inventories
Fri - Apr 17 - 08:30 - Consumer Price Index (CPI)
Fri - Apr 17 - 10:00 - Michigan Sentiment
Fri - Apr 17 - 10:00 - Leading Economic Indicators
Wed - Apr 22 - 07:00 - MBA Mortgage Index
Wed - Apr 22 - 09:00 - FHFA Housing Price Index
Wed - Apr 22 - 10:00 - Existing Home Sales
Wed - Apr 22 - 10:30 - Oil Inventories
Thu - Apr 23 - 08:30 - Initial Jobless Claims
Thu - Apr 23 - 10:00 - New Home Sales
Thu - Apr 23 - 10:30 - Natural Gas Inventories
Fri - Apr 24 - 08:30 - Durable Goods Orders
Tue - Apr 28 - 09:00 - Case-Shiller Housing Index
Tue - Apr 28 - 10:00 - Consumer Confidence
Wed - Apr 29 - 07:00 - MBA Mortgage Purchase Index
Wed - Apr 29 - 10:00 - Pending Home Sales
Wed - Apr 29 - 10:30 - Oil Inventories
Wed - Apr 29 - 14:00 - FOMC Rate Decision
Thu - Apr 30 - 08:30 - Initial Jobless Claims
Thu - Apr 30 - 08:30 - PCE Prices
Thu - Apr 30 - 08:30 - Personal Income & Personal Spending
Thu - Apr 30 - 09:45 - Chicago PMI
Thu - Apr 30 - 10:30 - Natural Gas Inventories
Fri - May 01 - 08:15 - ADP Employment Report
Fri - May 01 - 10:00 - Construction Spending
Fri - May 01 - 10:00 - ISM Manufacturing Index
Fri - May 01 - 10:00 - Michigan Sentiment
Fri - May 01 - 17:00 - Auto-Truck Sales
This commentary is designed to stimulate thinking. This analysis is not a recommendation to buy, sell, hold or sell short any security (stock ETF or otherwise). We all need to think for ourselves when it comes to trading our own accounts. First, it is the only way to really learn. Second, we are the only ones responsible for our decisions. Think of these charts as food for further analysis. Before making a trade, it is important to have a plan. Plan the trade and trade the plan. Among other things, this includes setting a trigger level, a target area and a stop-loss level. It is also important to plan for three possible price movements: advance, decline or sideways. Have a plan for all three scenarios BEFORE making the trade. Consider possible holding times. And finally, look at overall market conditions and sector/industry performance.


