Stocks meandered all day and finished slightly higher. QQQ (+.79%) and IWM (+86%) led the bounce with modest gains. SPY (+.34%) and DIA (+.18%) lagged. Seven of the nine sector SPDRs were up, but the gains and losses were small. Biotechs led the industry group ETFs as the Biotech SPDR (XBI) and Biotech iShares (IBB) surged almost 3%. Energy stocks lagged as oil fell 5%. It seems that 3-5% moves are the new normal for oil. The decline in oil lifted the Transport iShares (IYT) back above its rising 200-day moving average.
**This chart analysis is for educational purposes only, and should not
be construed as a recommendation to buy, sell or sell-short said securities**
Short-term Overview (Thursday, 9-April-2015):
- The short-term breadth indicators are mixed and lack conviction.
- Three of the five big sectors are in short-term downtrends.
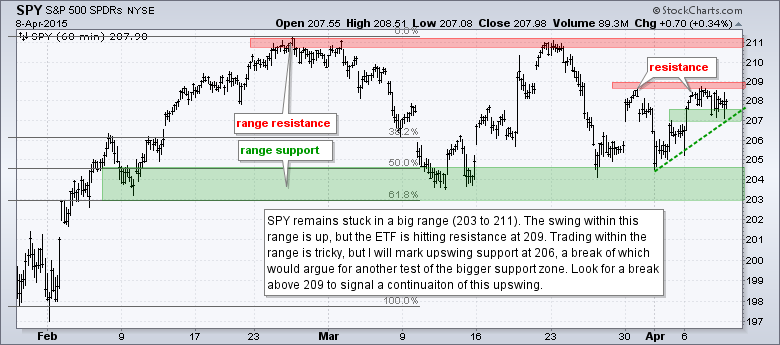
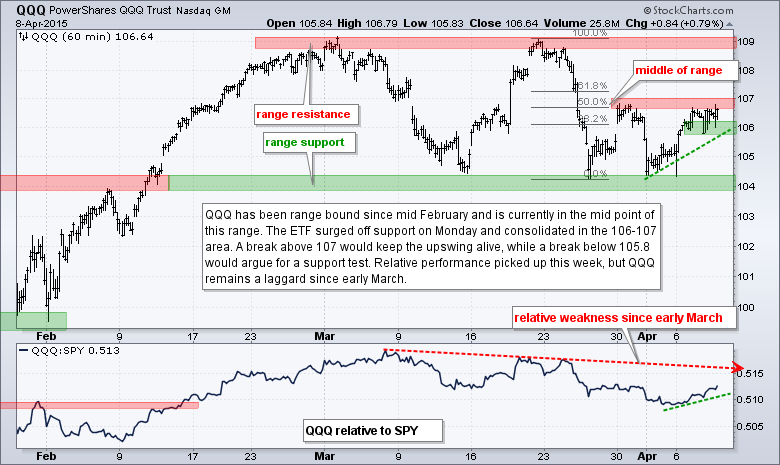
- SPY and QQQ are in upswings this month, but hitting resistance from the late March highs.
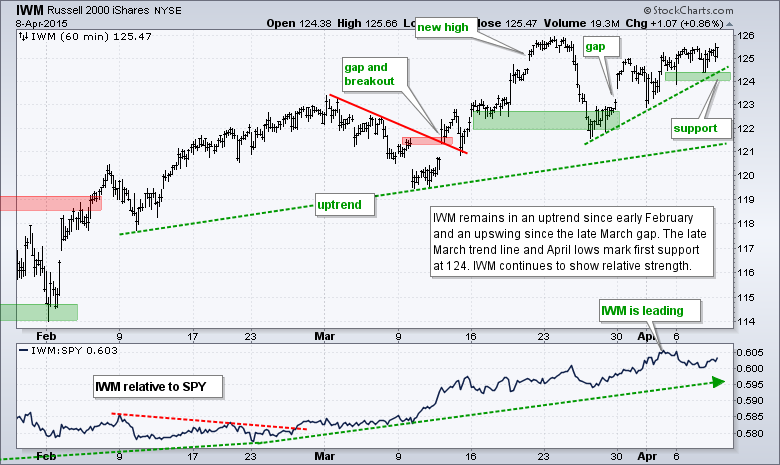
- IWM remains in an uptrend and shows relative strength.
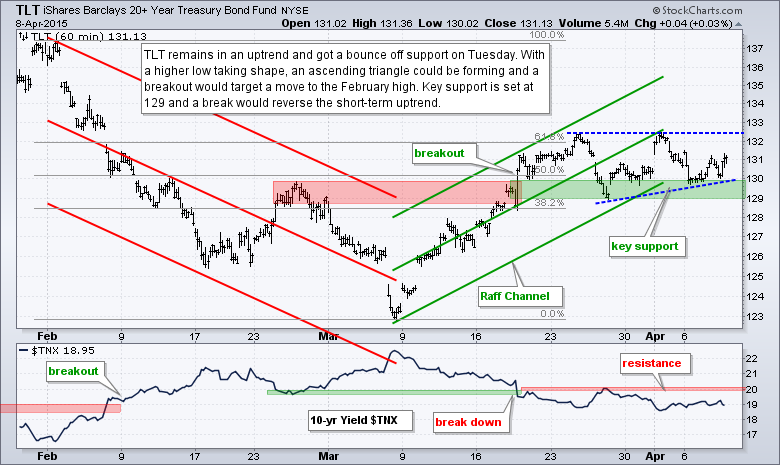
- TLT bounced off support and could be forming an ascending triangle.
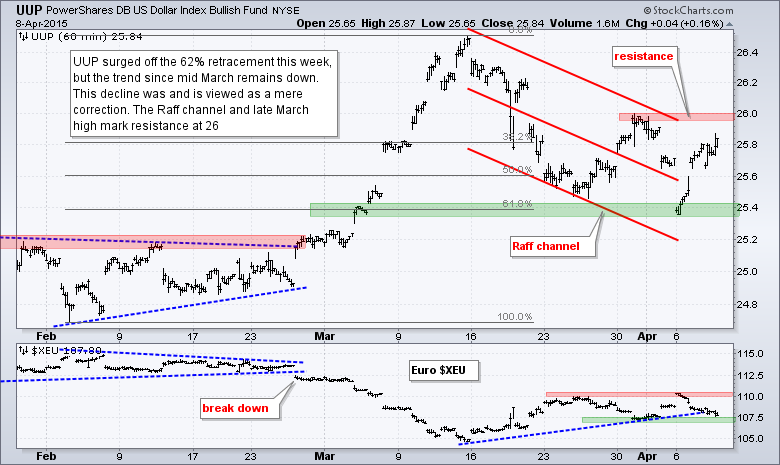
- UUP surged off the 62% retracement, but remains in a short-term downtrend.
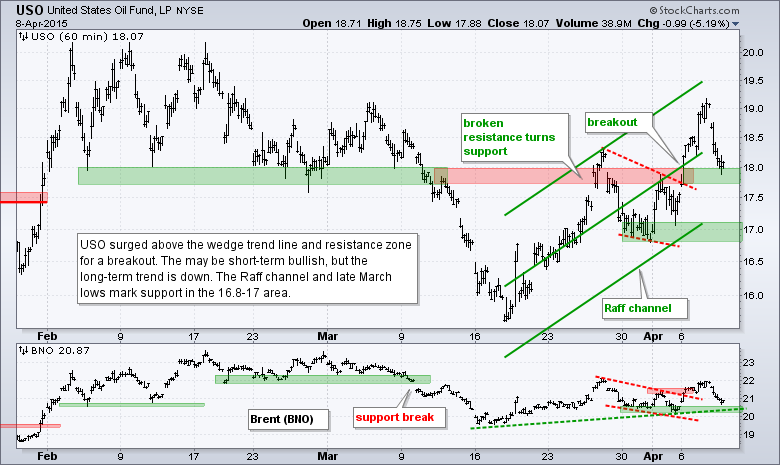
- USO plunged 5% to its breakout zone for its first support test.
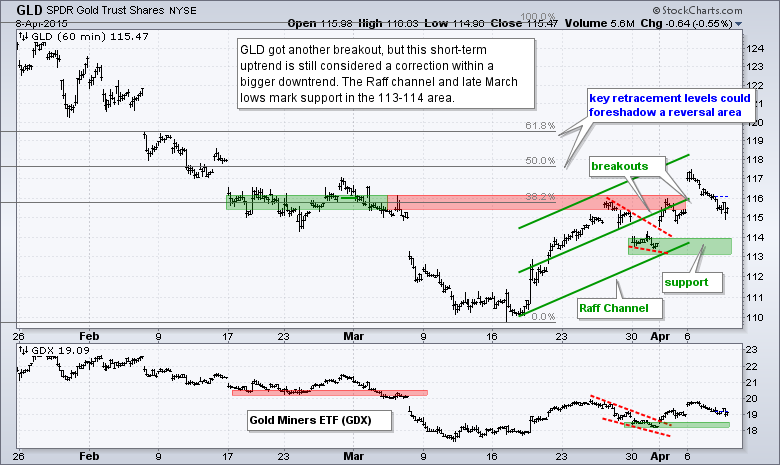
- GLD fell back this week, but remains in a short-term uptrend
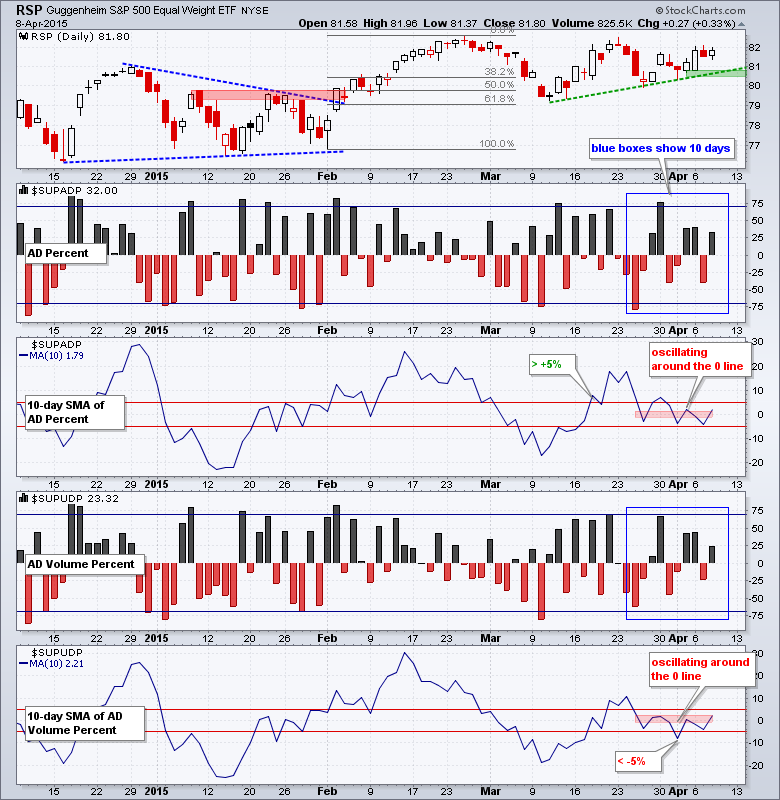
The Equal-Weight S&P 500 ETF (RSP) is in a short-term uptrend with the mid March trend line and Friday low marking support at 80.5. Breadth is all mixed up. The 10-day SMAs for AD Percent and AD Volume Percent continue to oscillate above/below zero without much conviction. The 10-day SMA for AD Percent triggered bullish with a move above +5% on March 18th, but the 10-day SMA for AD Volume Percent triggered bearish with a move below -5% on April 1st. Hence, short-term breadth is about as neutral as it can be.
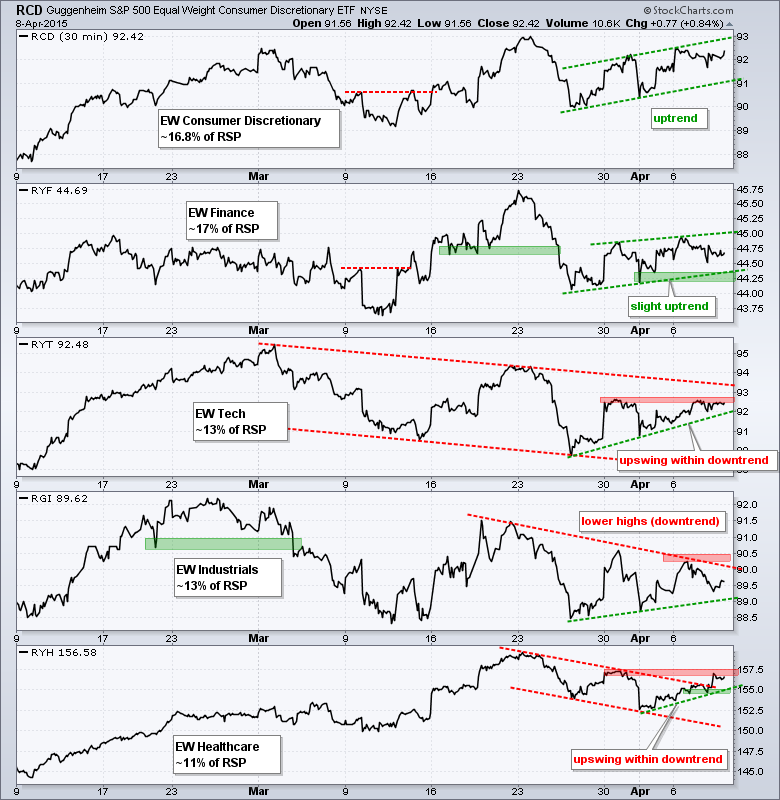
The sectors are also mixed. The Equal-Weight Consumer Discretionary ETF (RCD) and Equal-weight Finance ETF (RYF) are in uptrends since March 26th. The RYF uptrend, however, looks like a bear flag and a break below 44.25 would be bearish for the finance sector. The Equal-weight Technology ETF (RYT) and Equal-weight Industrials ETF (RGI) are in upswings of sorts since March 26th, but RYT has yet to clear the late March high and RGI formed a lower high. These upswings, therefore, are not that strong and the bigger trend is down for both. The Equal-weight Healthcare ETF (RYH) has been moving higher since April 1st, but has yet to clear resistance to reverse the bigger downtrend. Overall, it looks like three of the five are in short-term downtrends.
**************************************************************
**************************************************************
**************************************************************
**************************************************************
**************************************************************
**************************************************************
**************************************************************
***************************************************************
Key Reports and Events (all times Eastern):
Thu - Apr 09 - 08:30 - Initial Jobless Claims
Thu - Apr 09 - 10:30 - Natural Gas Inventories
Tue - Apr 14 - 08:30 - Retail Sales
Tue - Apr 14 - 08:30 - Producer Price Index (PPI)
Wed - Apr 15 - 07:00 - MBA Mortgage Index
Wed - Apr 15 - 08:30 - Empire State Manufacturing
Wed - Apr 15 - 09:15 - Industrial Production
Wed - Apr 15 - 10:00 - NAHB Housing Market Index
Wed - Apr 15 - 10:30 - Oil Inventories
Wed - Apr 15 - 14:00 - Fed's Beige Book
Thu - Apr 16 - 08:30 - Initial Jobless Claims
Thu - Apr 16 - 08:30 - Housing Starts & Building Permits
Thu - Apr 16 - 10:00 - Philadelphia Fed
Thu - Apr 16 - 10:30 - Natural Gas Inventories
Fri - Apr 17 - 08:30 - Consumer Price Index (CPI)
Fri - Apr 17 - 10:00 - Michigan Sentiment
Fri - Apr 17 - 10:00 - Leading Economic Indicators
Wed - Apr 22 - 07:00 - MBA Mortgage Index
Wed - Apr 22 - 09:00 - FHFA Housing Price Index
Wed - Apr 22 - 10:00 - Existing Home Sales
Wed - Apr 22 - 10:30 - Oil Inventories
Thu - Apr 23 - 08:30 - Initial Jobless Claims
Thu - Apr 23 - 10:00 - New Home Sales
Thu - Apr 23 - 10:30 - Natural Gas Inventories
Fri - Apr 24 - 08:30 - Durable Goods Orders
Tue - Apr 28 - 09:00 - Case-Shiller Housing Index
Tue - Apr 28 - 10:00 - Consumer Confidence
Wed - Apr 29 - 07:00 - MBA Mortgage Purchase Index
Wed - Apr 29 - 10:00 - Pending Home Sales
Wed - Apr 29 - 10:30 - Oil Inventories
Wed - Apr 29 - 14:00 - FOMC Rate Decision
Thu - Apr 30 - 08:30 - Initial Jobless Claims
Thu - Apr 30 - 08:30 - PCE Prices
Thu - Apr 30 - 08:30 - Personal Income & Personal Spending
Thu - Apr 30 - 09:45 - Chicago PMI
Thu - Apr 30 - 10:30 - Natural Gas Inventories
Fri - May 01 - 08:15 - ADP Employment Report
Fri - May 01 - 10:00 - Construction Spending
Fri - May 01 - 10:00 - ISM Manufacturing Index
Fri - May 01 - 10:00 - Michigan Sentiment
Fri - May 01 - 17:00 - Auto-Truck Sales
This commentary is designed to stimulate thinking. This analysis is not a recommendation to buy, sell, hold or sell short any security (stock ETF or otherwise). We all need to think for ourselves when it comes to trading our own accounts. First, it is the only way to really learn. Second, we are the only ones responsible for our decisions. Think of these charts as food for further analysis. Before making a trade, it is important to have a plan. Plan the trade and trade the plan. Among other things, this includes setting a trigger level, a target area and a stop-loss level. It is also important to plan for three possible price movements: advance, decline or sideways. Have a plan for all three scenarios BEFORE making the trade. Consider possible holding times. And finally, look at overall market conditions and sector/industry performance.


