It was a rather strange week for stocks. DIA and SPY were up around .50% as of Thursday's close, but Friday's decline in stock futures wiped out this small gain and they ended the week slightly negative - for all intents and purposes. IWM was up around 2% at Thursday's close and leading, but was also hit with selling in the futures market on Friday. Overall, there was more selling pressure than buying pressure last week, and the bulk of the short-term evidence is bearish. There are some interesting pockets of strength though. The Home Construction iShares (ITB) hit a new high last week and the Solar Energy ETF (TAN) rose over 4%. Also note that interest rate sensitive groups were strong last week and should benefit from Friday's decline in the 10-YR Treasury Yield ($TNX). The Utilities SPDR (XLU) gained 2.13% through Thursday and the Telecom iShares (IYZ) was up over 3%.
**This chart analysis is for educational purposes only, and should not
be construed as a recommendation to buy, sell or sell-short said securities**
Short-term Overview (Monday, 6-April-2015):
- Short-term breadth is bearish.
- Three of the five big sectors are in short-term downtrends.
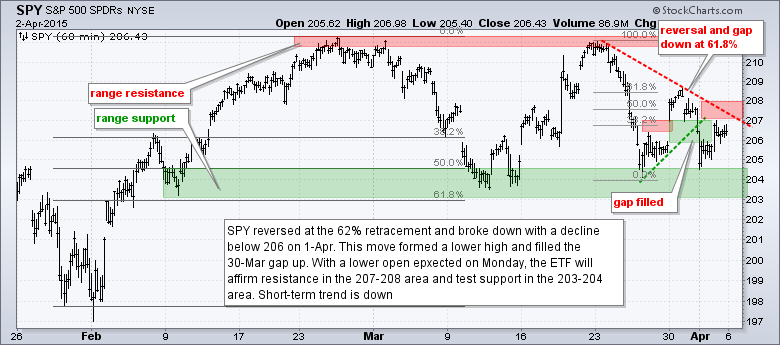
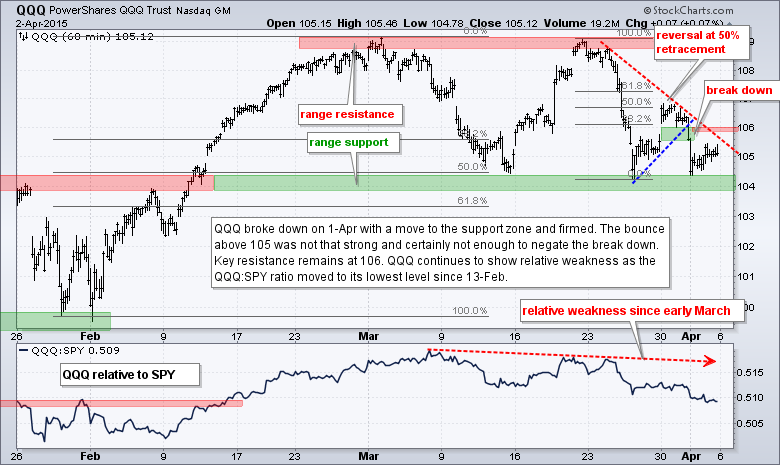
- SPY and QQQ filled Monday's gaps and broke short-term support on April 1st.
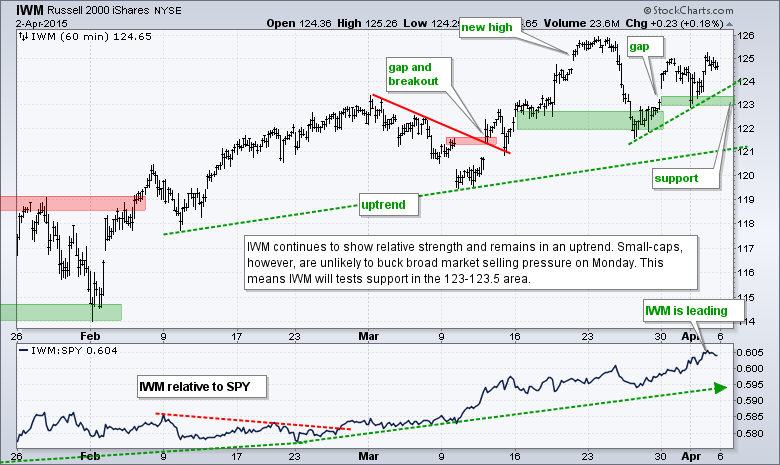
- IWM continues to hold Monday's gap zone and shows relative strength.
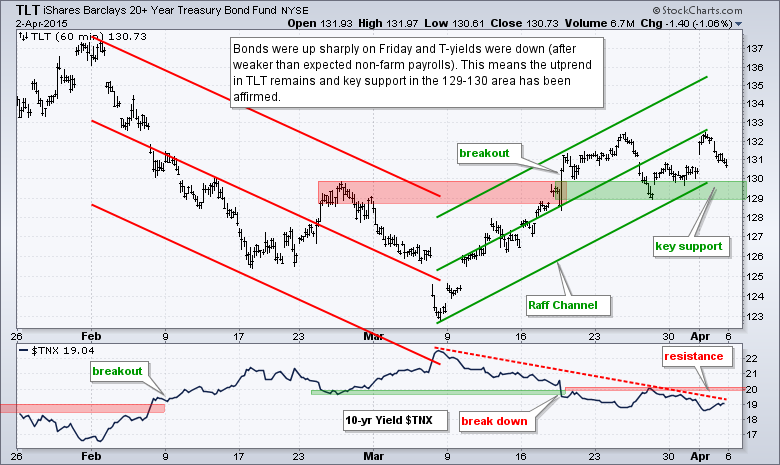
- TLT extended its bounce off support and remains in a short-term uptrend.
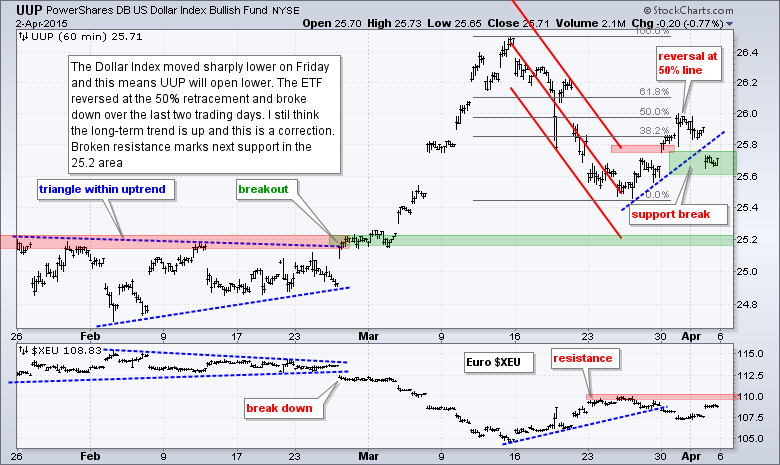
- UUP reversed at the 50% retracement and broke short-term support last week.
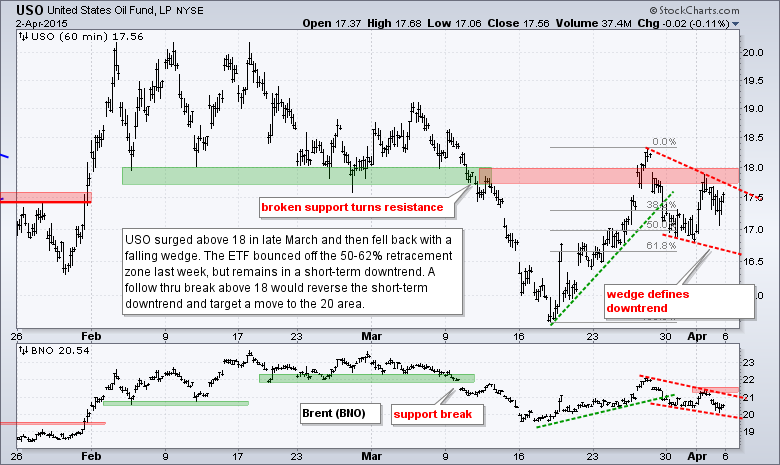
- USO is in a short-term downtrend defined by a small falling wedge.
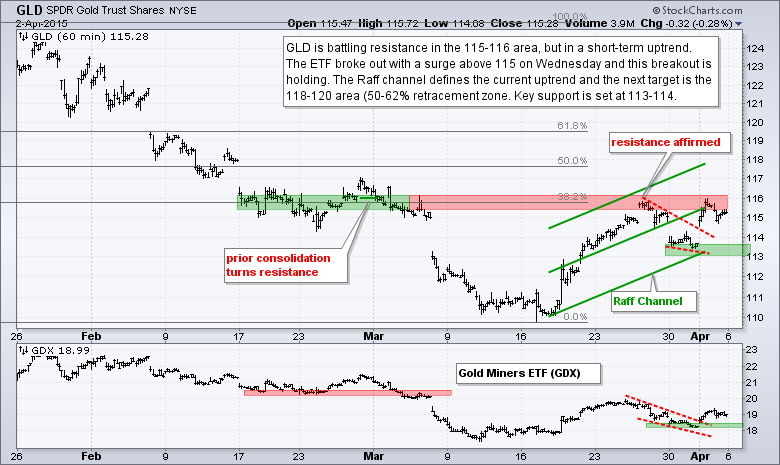
- GLD broke out last week and is in a short-term uptrend.
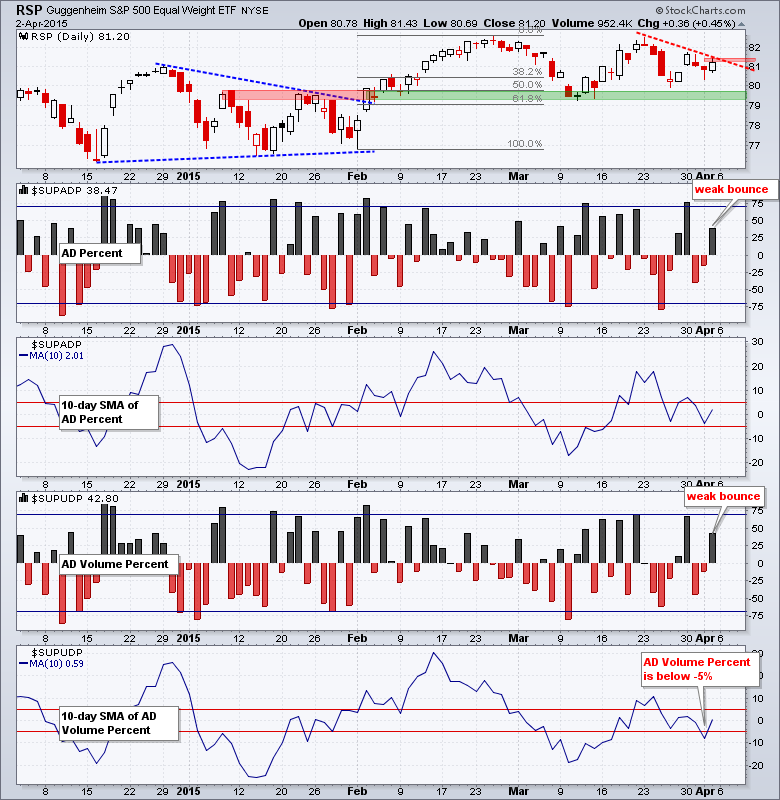
The Equal-Weight S&P 500 ETF (RSP) bounced on Thursday, but the futures were down on Friday and the ETF is likely to open lower Monday morning. This means resistance can be set at 81.5 for this downswing and the ETF will test the March lows. S&P 1500 AD Percent ($SUPADP) and S&P 1500 AD Volume Percent ($SUPUDP) bounced on Thursday, but the bounce was not that strong because neither exceeded +50%, and fell well short of the +70% level. The 10-day SMA for S&P 1500 AD Volume Percent ($SUPUDP) broke below -5% on Wednesday to turn bearish and remains bearish until there is a counter signal with a move above +5%.
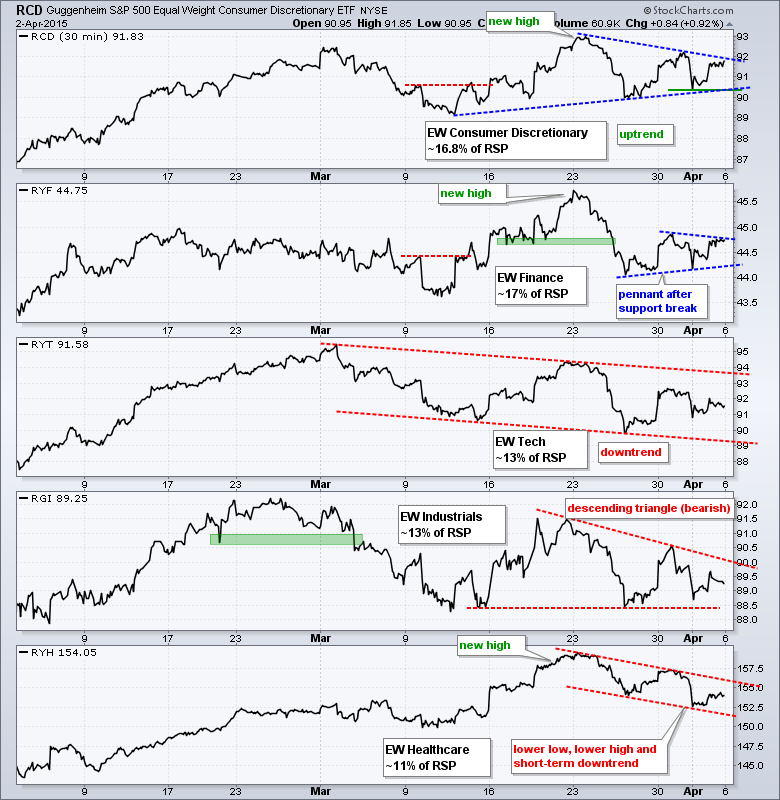
With stocks set for a weak open on Monday, I am assuming that the five equal-weight sector ETFs will also move lower on the open. Three of the five sectors are in downtrends and the other two are up for big tests. This means the Equal-Weight Consumer Discretionary ETF (RCD) will form a lower high at 92 and test support in the 90 area, a break of which would be bearish. The Equal-weight Finance ETF (RYF) will test the lower trend line of a pennant. RCD and RYF are the only sectors holding up right now and breakdowns in these two would be bearish for the broader market. The Equal-weight Technology ETF (RYT) has been trending lower since early March, the Equal-weight Industrials ETF (RGI) peaked in late February and formed a bearish descending triangle and the Equal-weight Healthcare ETF (RYH) is in a downtrend since March 23rd.
The short-term evidence is bearish and Friday's decline in the futures market suggests a weak open on Monday. SPY and QQQ are in short-term downtrends, but IWM remains in a short-term uptrend and shows relative strength. Breadth is bearish because S&P 1500 AD Volume Percent ($SUPUDP) triggered a bearish signal and Thursday's bounce was weak. The sectors are bearish because three of the five are in short-term downtrends.
**************************************************************
**************************************************************
**************************************************************
**************************************************************
**************************************************************
**************************************************************
**************************************************************
***************************************************************
Key Reports and Events (all times Eastern):
Mon - Apr 06 - 10:00 - ISM Services Index
Tue - Apr 07 - 10:00 - JOLTS
Wed - Apr 08 - 07:00 - MBA Mortgage Index
Wed - Apr 08 - 10:30 - Oil Inventories
Wed - Apr 08 - 14:00 - FOMC Minutes
Thu - Apr 09 - 08:30 - Initial Jobless Claims
Thu - Apr 09 - 10:30 - Natural Gas Inventories
Tue - Apr 14 - 08:30 - Retail Sales
Tue - Apr 14 - 08:30 - Producer Price Index (PPI)
Wed - Apr 15 - 07:00 - MBA Mortgage Index
Wed - Apr 15 - 08:30 - Empire State Manufacturing
Wed - Apr 15 - 09:15 - Industrial Production
Wed - Apr 15 - 10:00 - NAHB Housing Market Index
Wed - Apr 15 - 10:30 - Oil Inventories
Wed - Apr 15 - 14:00 - Fed's Beige Book
Thu - Apr 16 - 08:30 - Initial Jobless Claims
Thu - Apr 16 - 08:30 - Housing Starts & Building Permits
Thu - Apr 16 - 10:00 - Philadelphia Fed
Thu - Apr 16 - 10:30 - Natural Gas Inventories
Fri - Apr 17 - 08:30 - Consumer Price Index (CPI)
Fri - Apr 17 - 10:00 - Michigan Sentiment
Fri - Apr 17 - 10:00 - Leading Economic Indicators
Wed - Apr 22 - 07:00 - MBA Mortgage Index
Wed - Apr 22 - 09:00 - FHFA Housing Price Index
Wed - Apr 22 - 10:00 - Existing Home Sales
Wed - Apr 22 - 10:30 - Oil Inventories
Thu - Apr 23 - 08:30 - Initial Jobless Claims
Thu - Apr 23 - 10:00 - New Home Sales
Thu - Apr 23 - 10:30 - Natural Gas Inventories
Fri - Apr 24 - 08:30 - Durable Goods Orders
Tue - Apr 28 - 09:00 - Case-Shiller Housing Index
Tue - Apr 28 - 10:00 - Consumer Confidence
Wed - Apr 29 - 07:00 - MBA Mortgage Purchase Index
Wed - Apr 29 - 10:00 - Pending Home Sales
Wed - Apr 29 - 10:30 - Oil Inventories
Wed - Apr 29 - 14:00 - FOMC Rate Decision
Thu - Apr 30 - 08:30 - Initial Jobless Claims
Thu - Apr 30 - 08:30 - PCE Prices
Thu - Apr 30 - 08:30 - Personal Income & Personal Spending
Thu - Apr 30 - 09:45 - Chicago PMI
Thu - Apr 30 - 10:30 - Natural Gas Inventories
Fri - May 01 - 08:15 - ADP Employment Report
Fri - May 01 - 10:00 - Construction Spending
Fri - May 01 - 10:00 - ISM Manufacturing Index
Fri - May 01 - 10:00 - Michigan Sentiment
Fri - May 01 - 17:00 - Auto-Truck Sales
This commentary is designed to stimulate thinking. This analysis is not a recommendation to buy, sell, hold or sell short any security (stock ETF or otherwise). We all need to think for ourselves when it comes to trading our own accounts. First, it is the only way to really learn. Second, we are the only ones responsible for our decisions. Think of these charts as food for further analysis. Before making a trade, it is important to have a plan. Plan the trade and trade the plan. Among other things, this includes setting a trigger level, a target area and a stop-loss level. It is also important to plan for three possible price movements: advance, decline or sideways. Have a plan for all three scenarios BEFORE making the trade. Consider possible holding times. And finally, look at overall market conditions and sector/industry performance.


