Stocks were lower most of the day, but rallied in the final fifteen minutes to cut their losses. SPY closed with a small loss and IWM closed with a fractional gain. The sector SPDRs did not move much either. Healthcare was the big loser with a 1% decline. Utilities bucked the selling pressure and rose along with bonds. Remember, utilities are positively correlated to bonds and negatively correlated to Treasury yields. We can expect some fireworks in the bond market over the next two days because the employment report will be released on Friday. The equity markets are closed on Friday, but the bond markets will be open for trading until noon.
**This chart analysis is for educational purposes only, and should not
be construed as a recommendation to buy, sell or sell-short said securities**
Short-term Overview (Thursday, 2-April-2015):
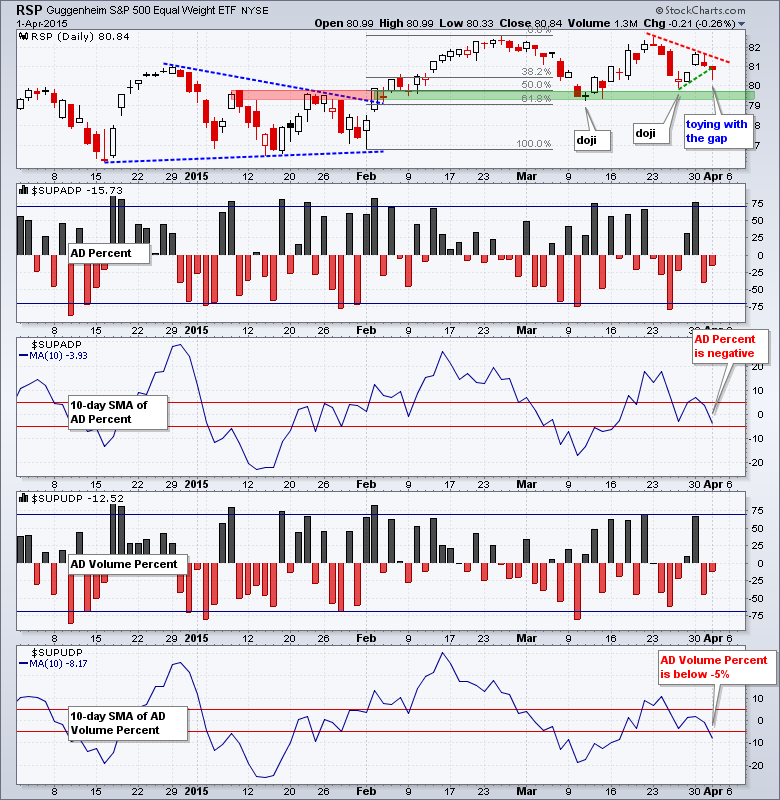
- Breadth is bearish with AD Percent and AD Volume Percent both negative.
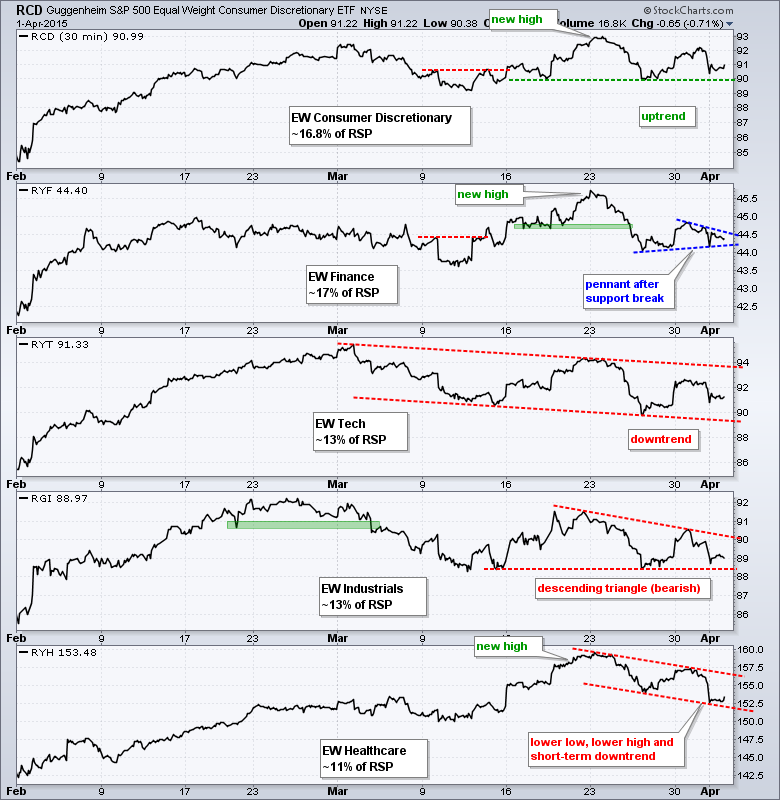
- Three of the five big sectors are in downtrends.
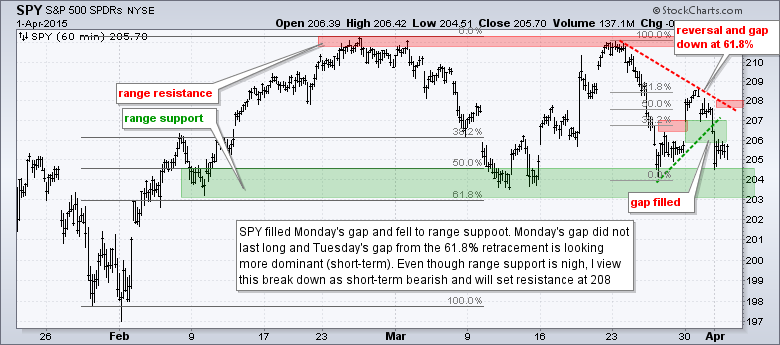
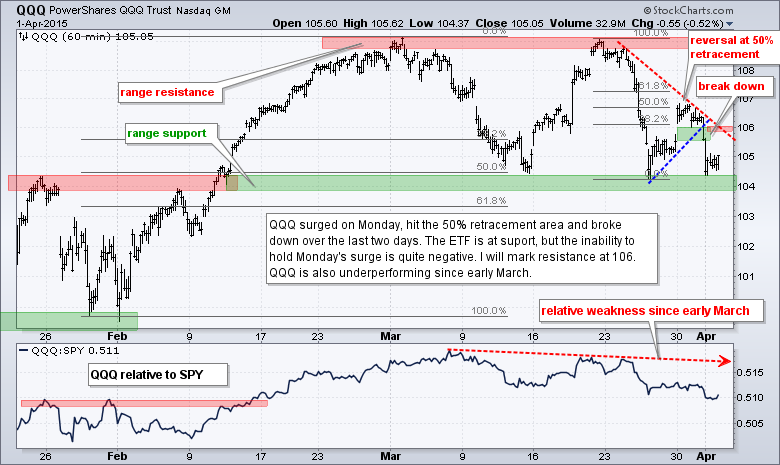
- SPY and QQQ filled Monday's gaps and broke short-term support on Wednesday.
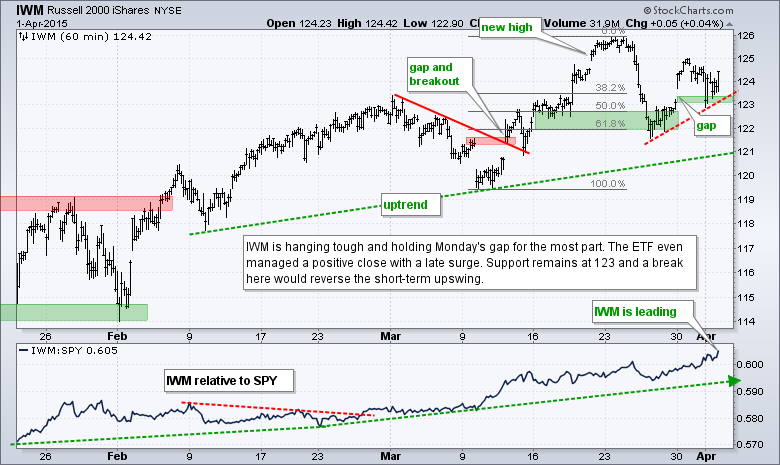
- IWM continues to hold Monday's gap zone and shows relative strength.
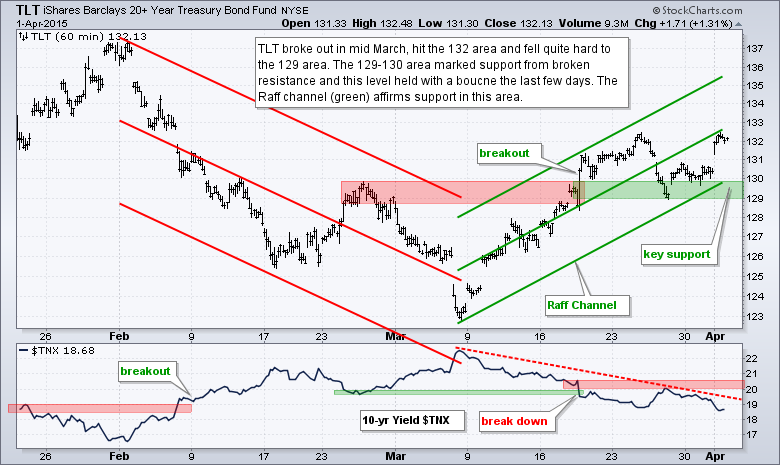
- TLT extended its bounce off support and remains in a short-term uptrend.
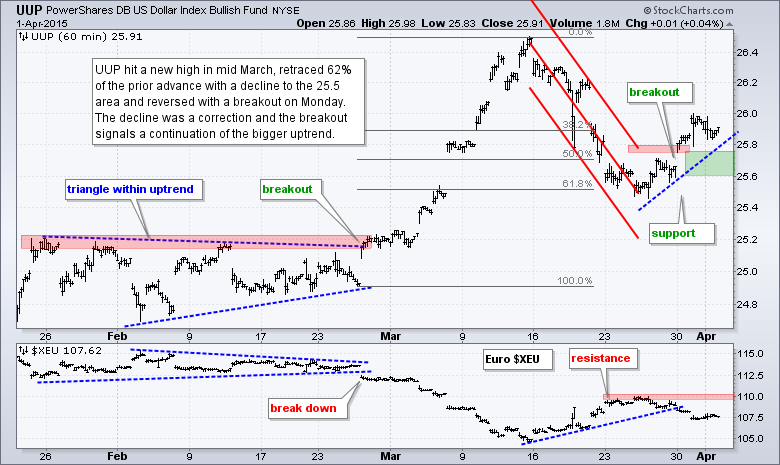
- UUP broke out with a gap and surge on Monday.
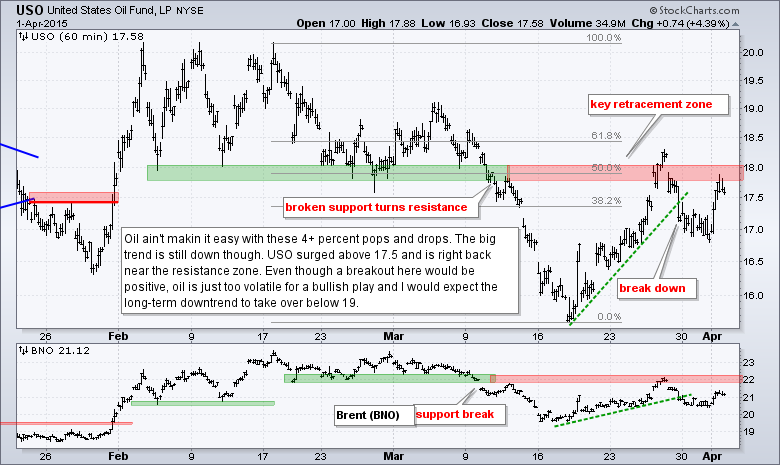
- USO has turned quite volatile with a surge to short-term resistance.
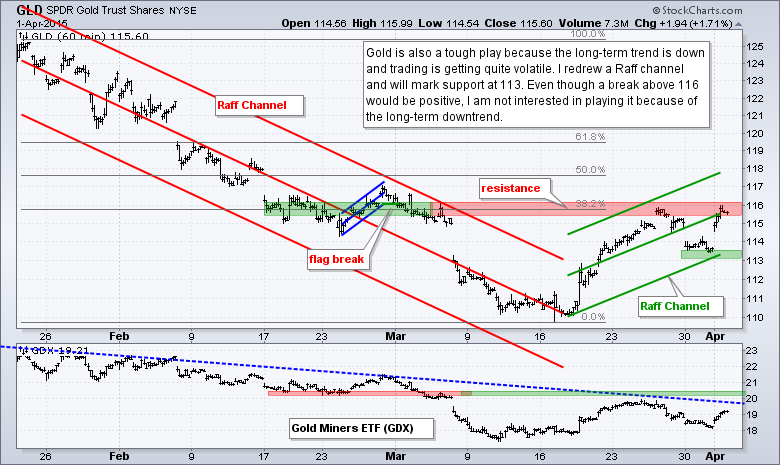
- GLD surged back to short-term resistance and I reset support.
The Equal-Weight S&P 500 ETF (RSP) toyed with Monday's gap by moving below the gap intraday and closing in the gap zone. Despite a close off the low, there was still more selling pressure than buying pressure and the gap did not hold very well. The 10-day SMA for AD Percent moved into negative territory and just below last week's low. The 10-day SMA for AD Volume Percent moved below -5% to turn outright bearish. Large-cap stocks are the volume leaders and weakness in AD Volume Percent reflects relative weakness in large-caps.
Three of the five equal-weight sectors hit new highs in early March (consumer discretionary, finance and healthcare). Of these three, only the Equal-Weight Consumer Discretionary ETF (RCD) is holding support and still in a short-term uptrend. Watch 90 for a break down in RCD. The Equal-weight Finance ETF (RYF) formed a pennant after breaking support last week, and a break below 44 would signal a continuation lower. The Equal-weight Technology ETF (RYT) has been trending lower since early March. The Equal-weight Industrials ETF (RGI) is forming a descending triangle, which is a bearish continuation pattern. The Equal-weight Healthcare ETF (RYH) is showing relative weakness over the last six days with a lower high last week and lower low this week. All told, I count three in clear downtrends (RYT, RGI, RYH), one in an uptrend (RCD) and one on the fence (RYF).
The short-term evidence has shifted back to the bears. SPY and QQQ erased Monday's gap and fell back to range support. IWM is holding the gap and showing relative strength. Small-caps are still the place to be, but they account for less than 10% of the total US stock market. Large-caps are the main drivers here. The breadth indicators also shifted to negative and the majority of big sectors are in short-term downtrends. Trading could remain volatile because the employment report is Friday. Also note that bonds are surging and this is sucking up money that could go into equities.
**************************************************************
**************************************************************
**************************************************************
**************************************************************
**************************************************************
**************************************************************
***************************************************************
Key Reports and Events (all times Eastern):
Thu - Apr 02 - 07:30 - Challenger Job
Thu - Apr 02 - 08:30 - Initial Jobless Claims
Thu - Apr 02 - 10:00 - Factory Orders
Thu - Apr 02 - 10:30 - Natural Gas Inventories
Fri - Apr 03 - 08:30 - Nonfarm Payrolls
Mon - Apr 06 - 10:00 - ISM Services Index
Tue - Apr 07 - 10:00 - JOLTS
Wed - Apr 08 - 07:00 - MBA Mortgage Index
Wed - Apr 08 - 10:30 - Oil Inventories
Wed - Apr 08 - 14:00 - FOMC Minutes
Thu - Apr 09 - 08:30 - Initial Jobless Claims
Thu - Apr 09 - 10:30 - Natural Gas Inventories
Tue - Apr 14 - 08:30 - Retail Sales
Tue - Apr 14 - 08:30 - Producer Price Index (PPI)
Wed - Apr 15 - 07:00 - MBA Mortgage Index
Wed - Apr 15 - 08:30 - Empire State Manufacturing
Wed - Apr 15 - 09:15 - Industrial Production
Wed - Apr 15 - 10:00 - NAHB Housing Market Index
Wed - Apr 15 - 10:30 - Oil Inventories
Wed - Apr 15 - 14:00 - Fed's Beige Book
Thu - Apr 16 - 08:30 - Initial Jobless Claims
Thu - Apr 16 - 08:30 - Housing Starts & Building Permits
Thu - Apr 16 - 10:00 - Philadelphia Fed
Thu - Apr 16 - 10:30 - Natural Gas Inventories
Fri - Apr 17 - 08:30 - Consumer Price Index (CPI)
Fri - Apr 17 - 10:00 - Michigan Sentiment
Fri - Apr 17 - 10:00 - Leading Economic Indicators
Wed - Apr 22 - 07:00 - MBA Mortgage Index
Wed - Apr 22 - 09:00 - FHFA Housing Price Index
Wed - Apr 22 - 10:00 - Existing Home Sales
Wed - Apr 22 - 10:30 - Oil Inventories
Thu - Apr 23 - 08:30 - Initial Jobless Claims
Thu - Apr 23 - 10:00 - New Home Sales
Thu - Apr 23 - 10:30 - Natural Gas Inventories
Fri - Apr 24 - 08:30 - Durable Goods Orders
Tue - Apr 28 - 09:00 - Case-Shiller Housing Index
Tue - Apr 28 - 10:00 - Consumer Confidence
Wed - Apr 29 - 07:00 - MBA Mortgage Purchase Index
Wed - Apr 29 - 10:00 - Pending Home Sales
Wed - Apr 29 - 10:30 - Oil Inventories
Wed - Apr 29 - 14:00 - FOMC Rate Decision
Thu - Apr 30 - 08:30 - Initial Jobless Claims
Thu - Apr 30 - 08:30 - PCE Prices
Thu - Apr 30 - 08:30 - Personal Income & Personal Spending
Thu - Apr 30 - 09:45 - Chicago PMI
Thu - Apr 30 - 10:30 - Natural Gas Inventories
Fri - May 01 - 08:15 - ADP Employment Report
Fri - May 01 - 10:00 - Construction Spending
Fri - May 01 - 10:00 - ISM Manufacturing Index
Fri - May 01 - 10:00 - Michigan Sentiment
Fri - May 01 - 17:00 - Auto-Truck Sales
This commentary is designed to stimulate thinking. This analysis is not a recommendation to buy, sell, hold or sell short any security (stock ETF or otherwise). We all need to think for ourselves when it comes to trading our own accounts. First, it is the only way to really learn. Second, we are the only ones responsible for our decisions. Think of these charts as food for further analysis. Before making a trade, it is important to have a plan. Plan the trade and trade the plan. Among other things, this includes setting a trigger level, a target area and a stop-loss level. It is also important to plan for three possible price movements: advance, decline or sideways. Have a plan for all three scenarios BEFORE making the trade. Consider possible holding times. And finally, look at overall market conditions and sector/industry performance.


