Stocks swooned on Tuesday and then recovered most of their losses on Wednesday. Techs led the way as the Technology SPDR (XLK) hit a new high and QQQ closed at a new closing high. Semiconductors led the rebound as the Semiconductor SPDR (XSD) surged over 3% and hit a new high. The HealthCare SPDR (XLV) is the second strongest sector overall as the ETF is within 1.2% of its mid March high and is less than 10 cents from last week's closing high. Biotechs continue to power healthcare and the Nasdaq 100 as the Biotech SPDR (XBI) challenges its spring highs.
**This chart analysis is for educational purposes only, and should not
be construed as a recommendation to buy, sell or sell-short said securities**
Short-term Overview (Thursday, 28-May-2015):
- Short-term breadth indicators are split: AD Percent is bearish and AD Volume Percent is bullish.
- All five equal-weight sectors are still in uptrends.
- SPY and QQQ bounced off support to keep their short-term uptrends alive.
- IWM bounced, but remains within a contracting range.
- TLT firmed last week and surged above short-term resistance on Tuesday to reverse its short-term downtrend.
- UUP broke out last week and the short-term trend is up.
- USO has a series of lower lows and lower highs working since early May (downtrend)
- GLD failed to hold last week's breakout and broke support this week to start a short-term downtrend.
The Equal-Weight S&P 500 ETF (RSP) surged off the 82 area and gained .82% on Wednesday. Even though the ETF did not fill Tuesday's gap, the move does keep the choppy uptrend alive. From low to high, the ETF is up 5% over a 45 day period. This is clearly a grind higher and I will err with the bulls as long as 81.5 holds.
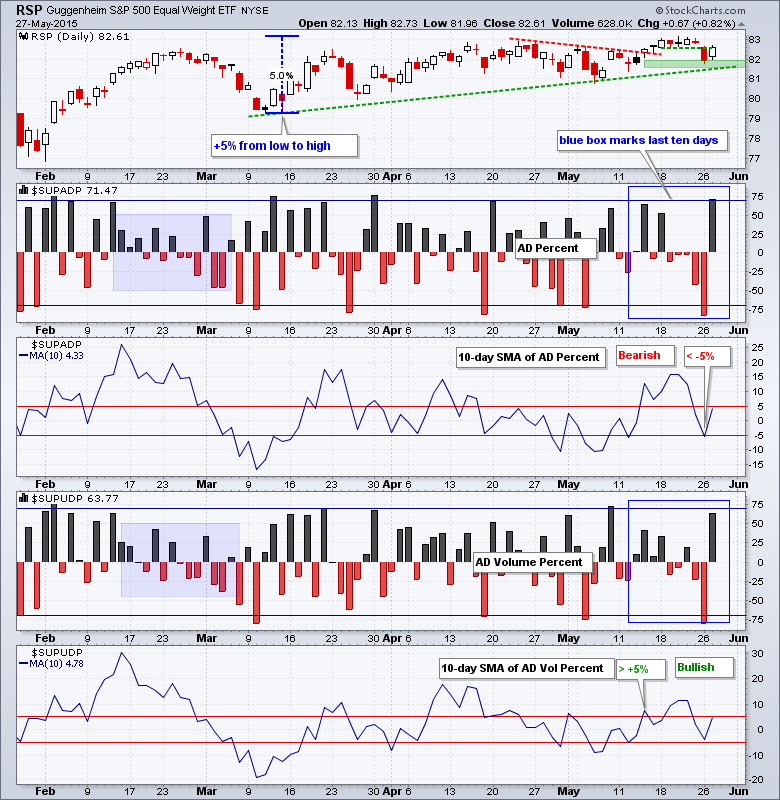
AD Percent and AD Volume Percent surged with broad buying pressure in the market on Wednesday. AD Percent hit its highest level since late March and AD Volume Percent hit its highest level since early May. Overall, breadth is split with AD Percent net bearish and AD Volume Percent net bullish. Note, however, that it would not take much to push the 10-day SMA for AD Percent above +5% again.
All five equal-weight sector ETFs bounced and remain in uptrends. There were three strong bounces and two weak bounces. The Equal-Weight Consumer Discretionary ETF (RCD) barely budged and the Equal-weight Industrials ETF (RGI) got a feeble bounce. The Equal-weight Technology ETF (RYT) led with a surge to a new high. The Equal-weight Healthcare ETF (RYH) is in second place and close to a new high.

**************************************************************

**************************************************************

**************************************************************

**************************************************************

**************************************************************

**************************************************************

**************************************************************

***************************************************************
Key Reports and Events (all times Eastern):
Thu - May 28 - 08:30 - Initial Jobless Claims
Thu - May 28 - 10:00 - Pending Home Sales
Thu - May 28 - 10:30 - Natural Gas Inventories
Thu - May 28 - 11:00 - Crude Oil Inventories
Fri - May 29 - 08:30 - GDP
Fri - May 29 - 09:45 - Chicago PMI
Fri - May 29 - 10:00 - Michigan Sentiment
This commentary is designed to stimulate thinking. This analysis is not a recommendation to buy, sell, hold or sell short any security (stock ETF or otherwise). We all need to think for ourselves when it comes to trading our own accounts. First, it is the only way to really learn. Second, we are the only ones responsible for our decisions. Think of these charts as food for further analysis. Before making a trade, it is important to have a plan. Plan the trade and trade the plan. Among other things, this includes setting a trigger level, a target area and a stop-loss level. It is also important to plan for three possible price movements: advance, decline or sideways. Have a plan for all three scenarios BEFORE making the trade. Consider possible holding times. And finally, look at overall market conditions and sector/industry performance.


