Stocks fell with selling pressure across the board. The major index ETFs were all down around 1% and the declines were pretty even. All sector SPDRs and equal-weight sector ETFs were down. The Consumer Discretionary SPDR (-.71%) and the Utilities SPDR (-.63%) were down the least and held up the best. The Regional Bank SPDR (KRE) held up relatively well with a .64% decline. Energy stocks were hit hard as oil fell and the Dollar rose. Commodity-related stocks were also hit hard as the Metals & Mining SPDR (XME) fell over 2% and the Gold Miners ETF (GDX) declined 2.95%.
**This chart analysis is for educational purposes only, and should not
be construed as a recommendation to buy, sell or sell-short said securities**
Short-term Overview (Wednesday, 27-May-2015):
- Short-term breadth indicators are split: AD Percent is bearish and AD Volume Percent is bullish.
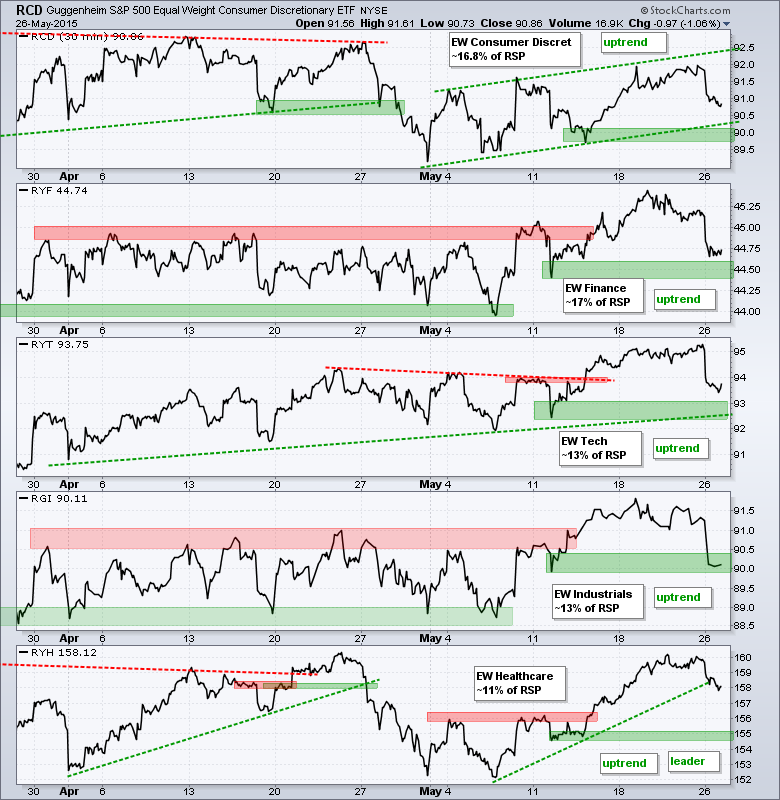
- All five equal-weight sectors are still in uptrends.
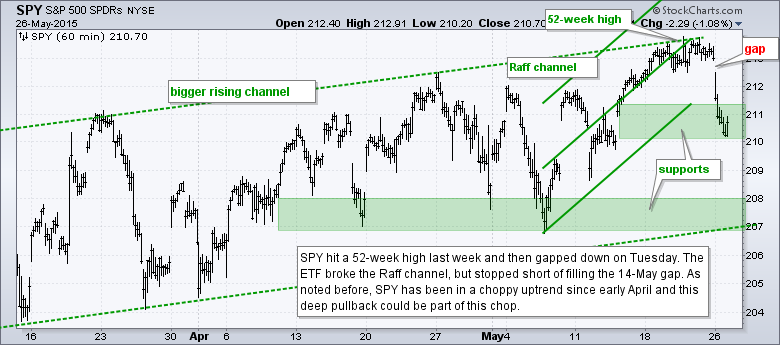
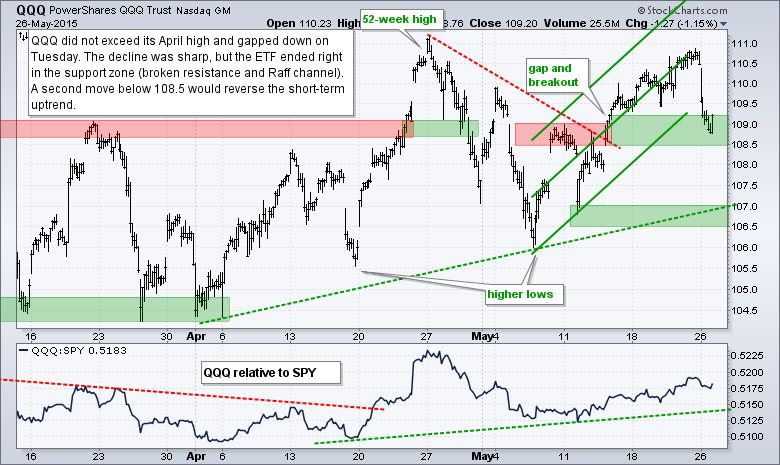
- SPY and QQQ gapped down and fell to support for a test of their short-term uptrends.
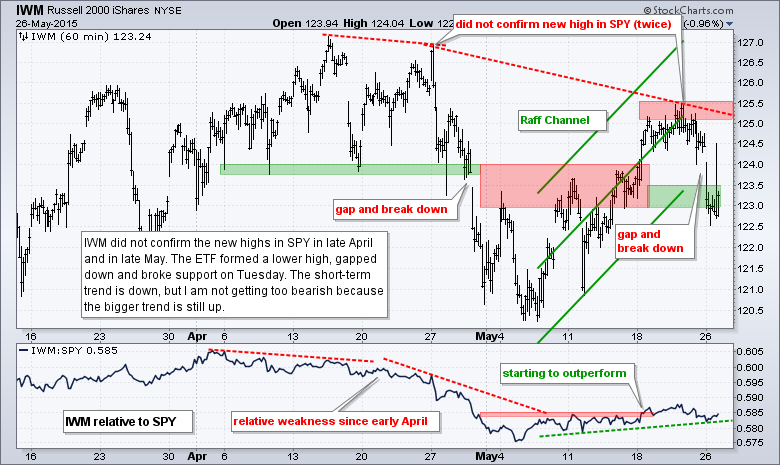
- IWM formed a lower high, gapped down and broke support to reverse the short-term uptrend.
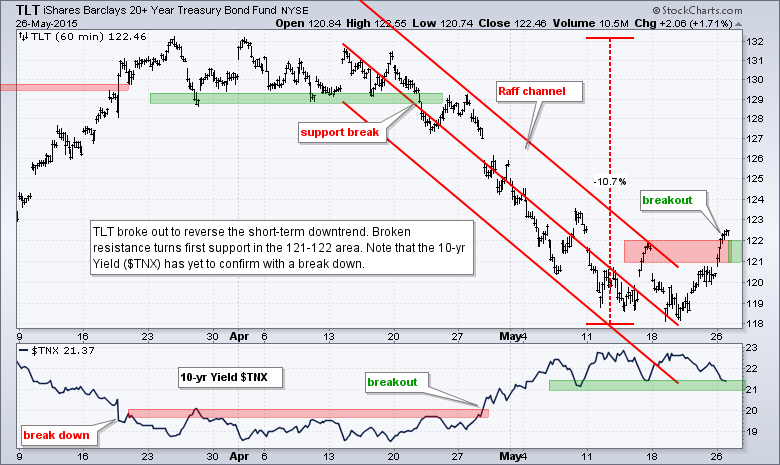
- TLT firmed last week and surged above short-term resistance on Tuesday to reverse its short-term downtrend.
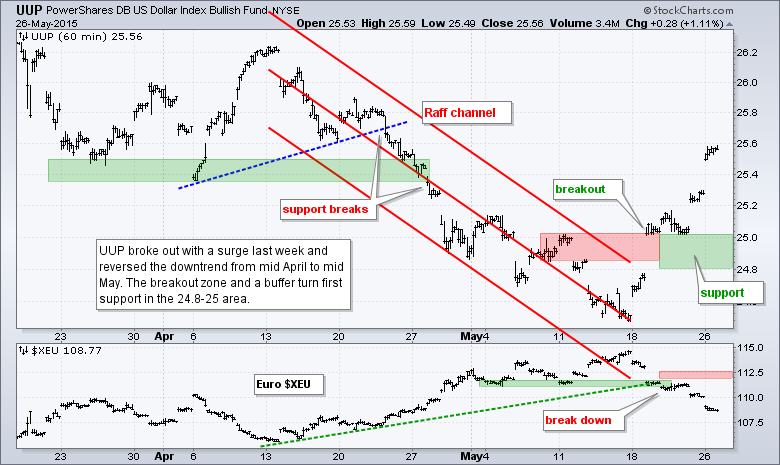
- UUP broke out last week and the short-term trend is up.
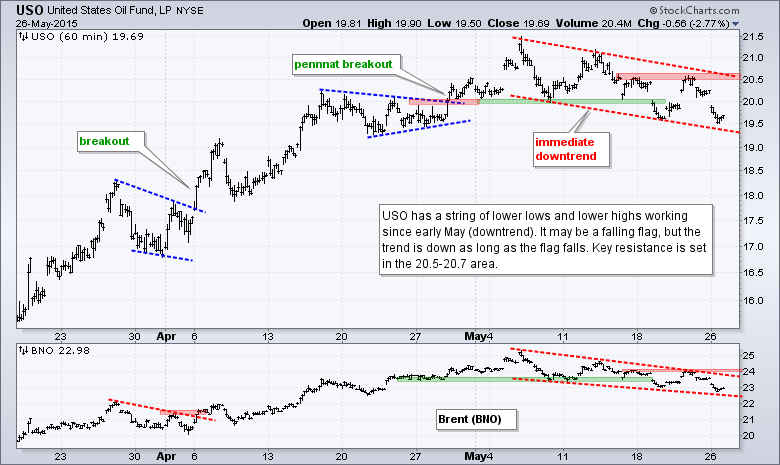
- USO has a series of lower lows and lower highs working since early May (downtrend)
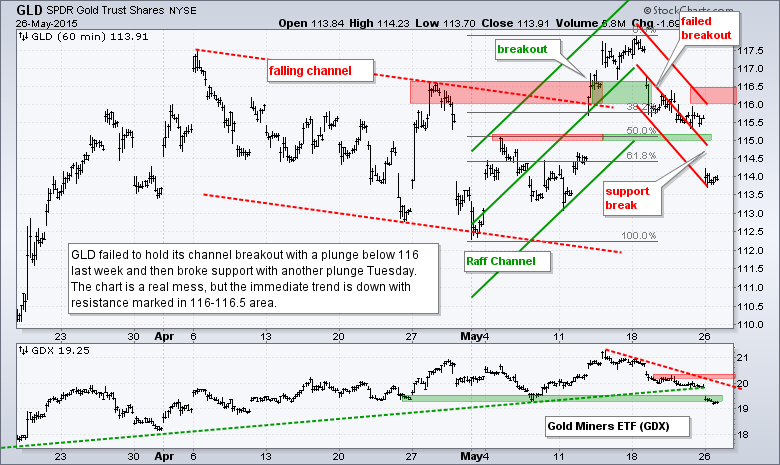
- GLD failed to hold last week's breakout and broke support this week to start a short-term downtrend.
The Equal-Weight S&P 500 ETF (RSP) opened weak and closed weak. There is actually a gap down in the 82.65 area and this gap held. I suppose the two week uptrend reversed, but the ETF is still within a three month uptrend. The mid May low and mid March trend line mark support in the 81-81.5 area.
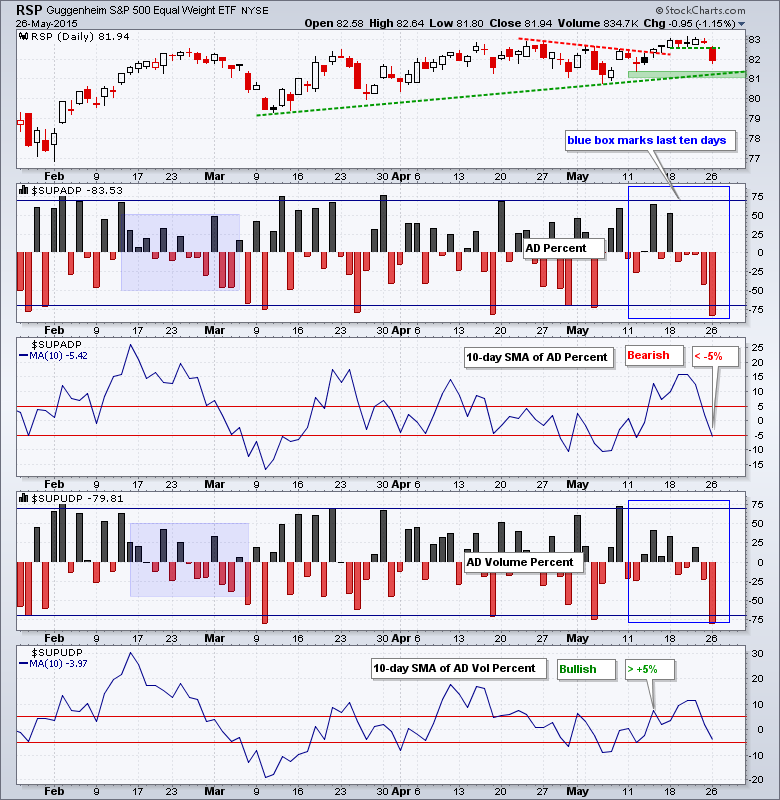
AD Percent plunged to -83% and hit its lowest level of the year. AD Volume Percent plunged to -80% and hit its lowest level since mid March. These extreme readings reflect broad selling pressure in the stock market. The 10-day SMA for AD Percent broke below -5% to turn bearish and this is negative for small-caps. The 10-day SMA for AD Volume Percent has yet to trigger and large-cap breadth remains bullish.
All five equal-weight sectors fell sharply on Tuesday. All five, however, remain in short-term uptrends. At this point, I am not going to let a one-day decline reverse the May uptrends. All five sector ETFs were up rather sharply from May 6th to May 20th (roughly). Tuesday's decline, while sharp, has retraced around 50% of this advance for RCD, RYF, RYT and RGI. RYH is holding up better. I am marking key supports at the mid May lows for all five. The sector balance will turn bearish when three of the five break these support levels.
**************************************************************
**************************************************************
**************************************************************
**************************************************************
**************************************************************
**************************************************************
**************************************************************
***************************************************************
Key Reports and Events (all times Eastern):
Wed - May 27 - 07:00 - MBA Mortgage Index
Thu - May 28 - 08:30 - Initial Jobless Claims
Thu - May 28 - 10:00 - Pending Home Sales
Thu - May 28 - 10:30 - Natural Gas Inventories
Thu - May 28 - 11:00 - Crude Oil Inventories
Fri - May 29 - 08:30 - GDP
Fri - May 29 - 09:45 - Chicago PMI
Fri - May 29 - 10:00 - Michigan Sentiment
This commentary is designed to stimulate thinking. This analysis is not a recommendation to buy, sell, hold or sell short any security (stock ETF or otherwise). We all need to think for ourselves when it comes to trading our own accounts. First, it is the only way to really learn. Second, we are the only ones responsible for our decisions. Think of these charts as food for further analysis. Before making a trade, it is important to have a plan. Plan the trade and trade the plan. Among other things, this includes setting a trigger level, a target area and a stop-loss level. It is also important to plan for three possible price movements: advance, decline or sideways. Have a plan for all three scenarios BEFORE making the trade. Consider possible holding times. And finally, look at overall market conditions and sector/industry performance.


