Stocks fell from Monday to Thursday and then surged on Friday with a strong open and strong close. QQQ and large-caps led the bounce, while IWM and small-caps lagged with smaller gains. The consumer discretionary, technology, industrials and materials sectors led with 1+ percent advances. The Home Construction iShares (ITB) and the Retail SPDR (XRT) paced the consumer discretionary sector with 1+ percent gains. Semiconductors led the tech sector as the Semiconductor iShares (SOXX) gained 2.78%.
**This chart analysis is for educational purposes only, and should not
be construed as a recommendation to buy, sell or sell-short said securities**
Short-term Overview (Monday, 4-May-2015):
- Short-term breadth indicators are split.
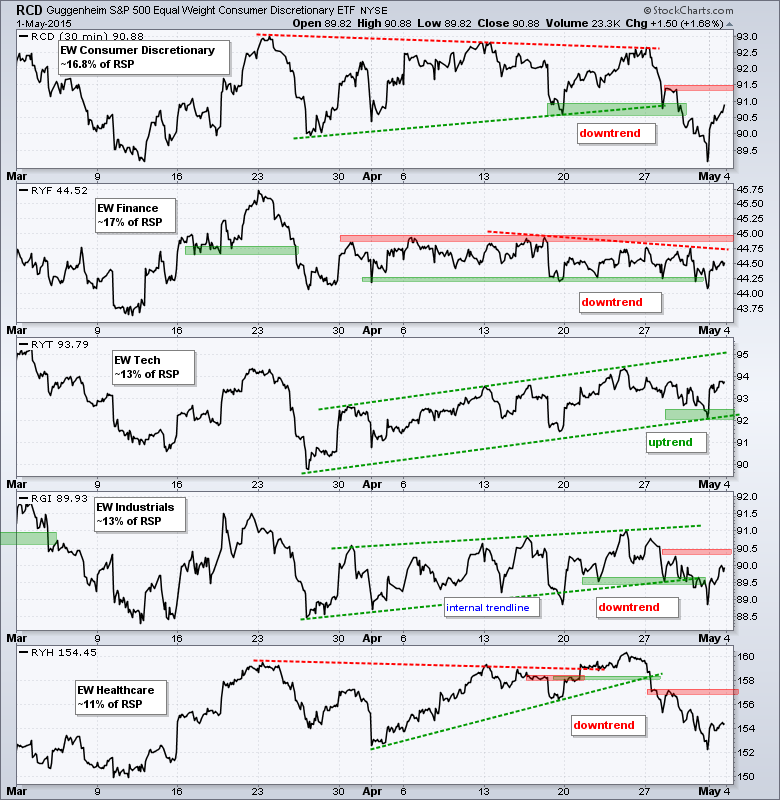
- Four of the five equal-weight sectors are in downtrends.
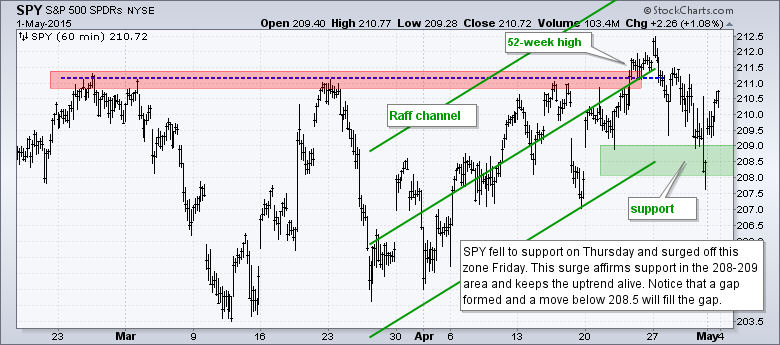
- SPY bounced off support to keep the uptrend alive.
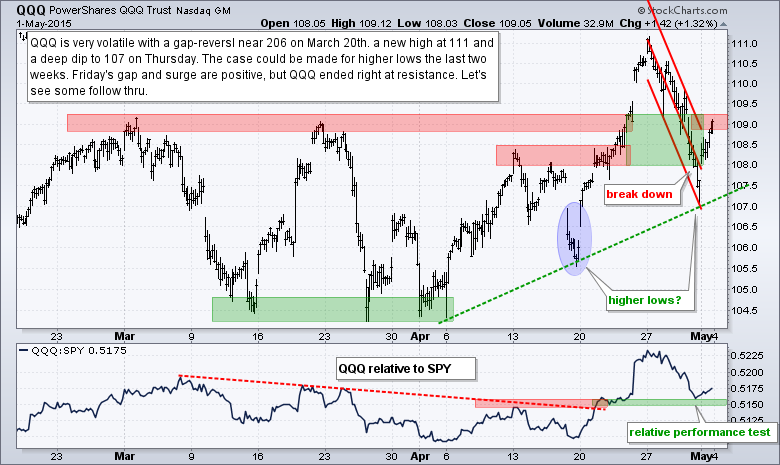
- QQQ rebounded to broken support for its first test.
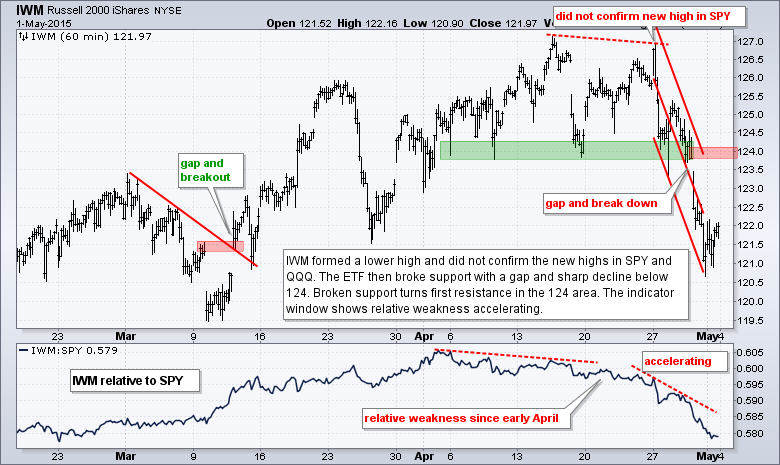
- IWM got a weak bounce on Friday and remains in a downtrend.
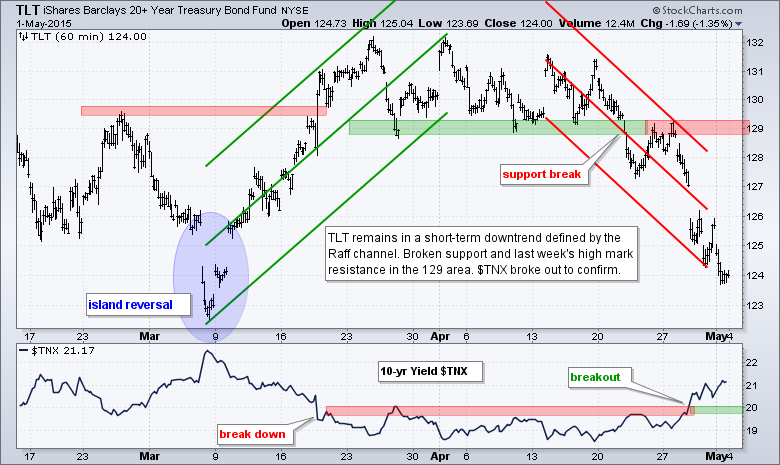
- TLT remains in a short-term downtrend heading into this week's employment report.
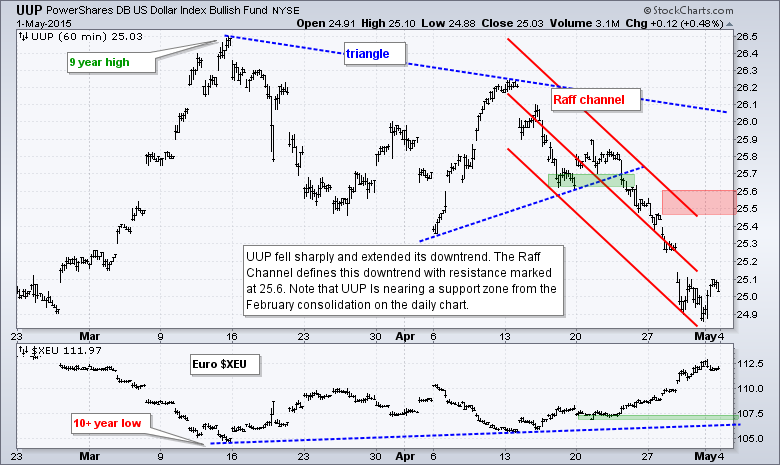
- UUP remains in a short-term downtrend.
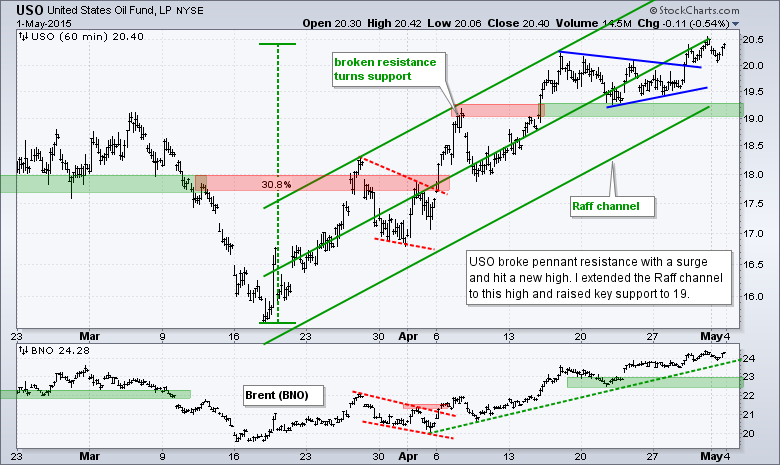
- USO broke pennant resistance and remains in an uptrend.
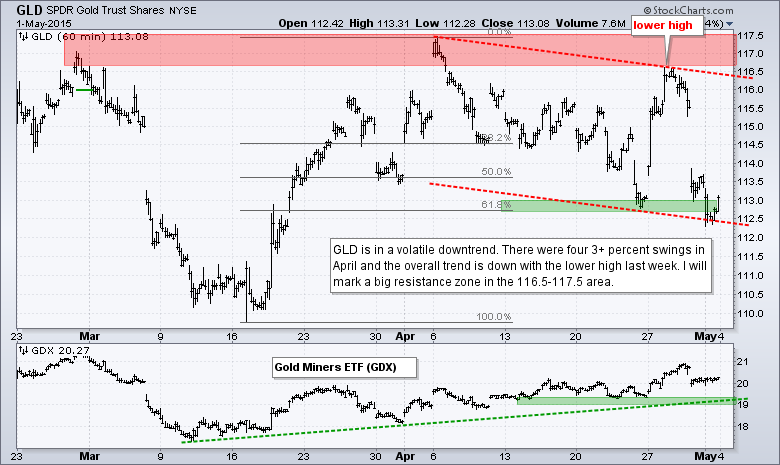
- GLD is in a volatile short-term downtrend.
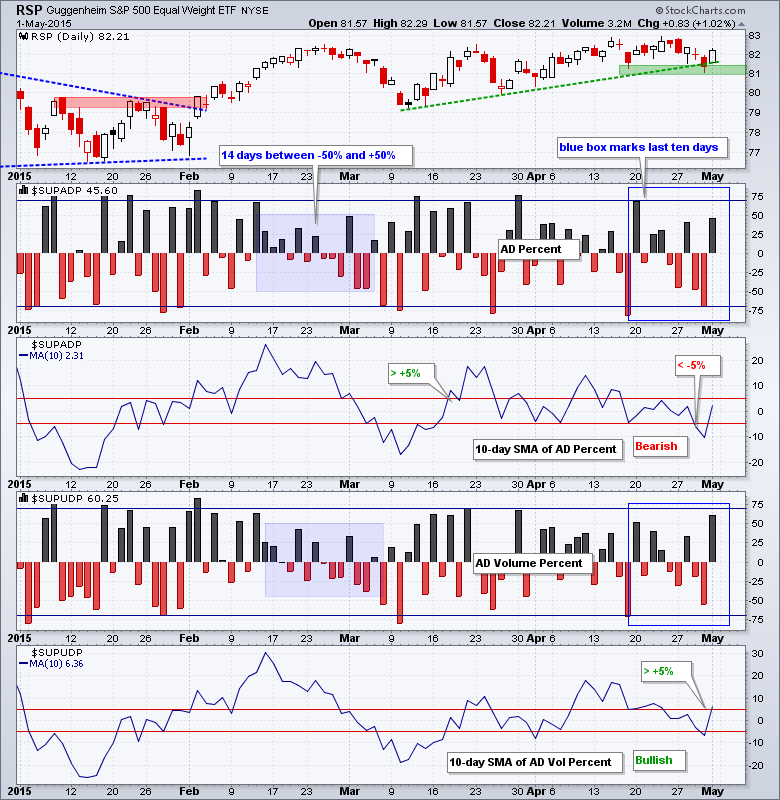
The Equal-Weight S&P 500 ETF (RSP) bounced with a move above 82 and affirmed support in the 81-81.5 area. The uptrend since mid March is choppy, but there is a clear upward bias as long as support holds. AD Percent finished at +45% and AD Volume Percent ended at +60%. The bigger number in AD Volume Percent points to relative strength in large-caps, which dominate volume. Note that the blue boxes mark the last ten days and the long red bar dropped out of the 10-day SMA. The removal of a big negative and addition of a positive pushed the 10-day SMA for AD Percent back above +5%, which is bullish. The 10-day SMA for AD Percent has yet to confirm and remains on a bearish signal, which was triggered last week. Also note that the long black bar from March 20th will drop out of the 10-day moving average after today's close and this will weigh on the 10-day SMA unless there is another big up day today.
The equal-weight sector ETFs bounced on Friday with the Equal-Weight Consumer Discretionary ETF (RCD) leading the way. Nevertheless, four of the five are in short-term downtrends still. The Equal-weight Finance ETF (RYF) is perhaps the dullest of the five because it has been in a tight range for over a month. There was a support break last week and the April highs mark range resistance. The Equal-weight Technology ETF (RYT) is the only sector still in an uptrend.
**************************************************************
**************************************************************
**************************************************************
**************************************************************
**************************************************************
**************************************************************
**************************************************************
***************************************************************
Key Reports and Events (all times Eastern):
Mon - May 04 - 10:00 - Factory Orders
Tue - May 05 - 08:30 - Trade Balance
Tue - May 05 - 10:00 - ISM Services Index
Wed - May 06 - 07:00 - MBA Mortgage Index
Wed - May 06 - 08:15 - ADP Employment Report
Wed - May 06 - 10:30 - Crude Oil Inventories
Thu - May 07 - 07:30 - Challenger Job Report
Thu - May 07 - 08:30 - Initial Jobless Claims
Thu - May 07 - 10:30 - Natural Gas Inventories
Thu - May 07 - 15:00 - Consumer Credit
Fri - May 08 - 08:30 - Employment Report
Tue - May 12 - 00:00 - JOLTS
Wed - May 13 - 07:00 - MBA Mortgage Index
Wed - May 13 - 08:30 - Retail Sales
Wed - May 13 - 10:00 - Business Inventories
Wed - May 13 - 10:30 - Crude Oil Inventories
Thu - May 14 - 08:30 - Initial Jobless Claims
Thu - May 14 - 08:30 - Producer Price Index (PPI)
Thu - May 14 - 10:30 - Natural Gas Inventories
Fri - May 15 - 08:30 - Empire State Manufacturing
Fri - May 15 - 09:15 - Industrial Production
Fri - May 15 - 10:00 - Michigan Sentiment
Mon - May 18 - 10:00 - NAHB Housing Market Index
Tue - May 19 - 08:30 - Housing Starts/Building Permits
Wed - May 20 - 07:00 - MBA Mortgage Index
Wed - May 20 - 10:30 - Crude Oil Inventories
Wed - May 20 - 14:00 - FOMC Minutes
Thu - May 21 - 08:30 - Initial Jobless Claims
Thu - May 21 - 10:00 - Existing Home Sales
Thu - May 21 - 10:00 - Philadelphia Fed
Thu - May 21 - 10:00 - Leading Indicators
Thu - May 21 - 10:30 - Natural Gas Inventories
Fri - May 22 - 08:30 - Consumer Price Index (CPI)
Tue - May 26 - 08:30 - Durable Goods Orders
Tue - May 26 - 09:00 - Case-Shiller 20-city Index
Tue - May 26 - 09:00 - FHFA Housing Price Index
Tue - May 26 - 10:00 - New Home Sales
Tue - May 26 - 10:00 - Consumer Confidence
Wed - May 27 - 07:00 - MBA Mortgage Index
Thu - May 28 - 08:30 - Initial Jobless Claims
Thu - May 28 - 10:00 - Pending Home Sales
Thu - May 28 - 10:30 - Natural Gas Inventories
Thu - May 28 - 11:00 - Crude Oil Inventories
Fri - May 29 - 08:30 - GDP
Fri - May 29 - 09:45 - Chicago PMI
Fri - May 29 - 10:00 - Michigan Sentiment
This commentary is designed to stimulate thinking. This analysis is not a recommendation to buy, sell, hold or sell short any security (stock ETF or otherwise). We all need to think for ourselves when it comes to trading our own accounts. First, it is the only way to really learn. Second, we are the only ones responsible for our decisions. Think of these charts as food for further analysis. Before making a trade, it is important to have a plan. Plan the trade and trade the plan. Among other things, this includes setting a trigger level, a target area and a stop-loss level. It is also important to plan for three possible price movements: advance, decline or sideways. Have a plan for all three scenarios BEFORE making the trade. Consider possible holding times. And finally, look at overall market conditions and sector/industry performance.


