Stocks closed modestly higher on Monday with the technology, healthcare and utilities sectors leading the way. It is most interesting to see utilities higher because the 10-YR Treasury Yield ($TNX) is up sharply over the last two weeks. Utilities have been negatively correlated to Treasury yields the last few months, but seem to be rebelling against this relationship. Banks were also strong on Monday with the Regional Bank SPDR (KRE) gaining over 1%. Banks are benefitting from a steepening yield curve as long-term rates rise faster than short-term rates.
**This chart analysis is for educational purposes only, and should not
be construed as a recommendation to buy, sell or sell-short said securities**
Short-term Overview (Tuesday, 5-May-2015):
- Short-term breadth indicators are split.
- Four of the five equal-weight sectors are in downtrends.
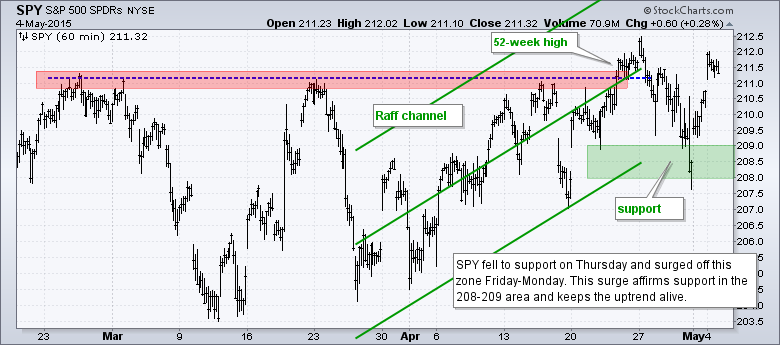
- SPY bounced off support to keep the uptrend alive.
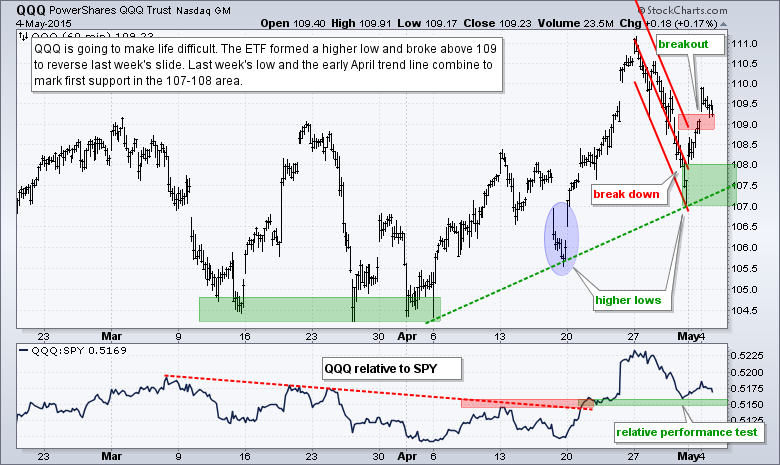
- QQQ formed a higher low and rebounded to renew the upswing.
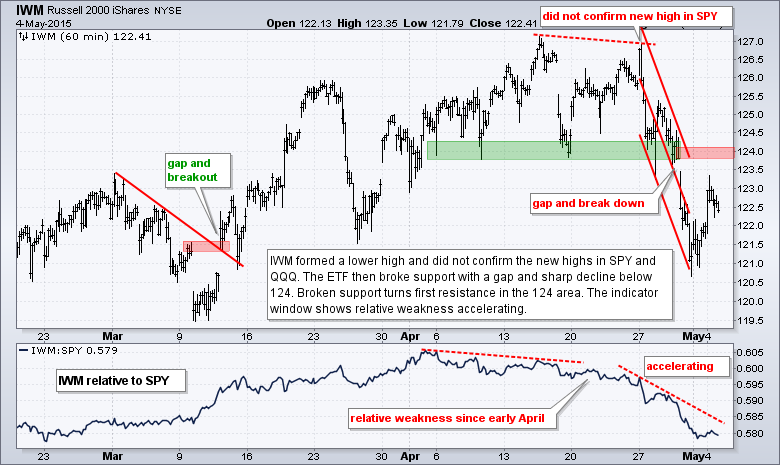
- IWM got a weak bounce on Friday-Monday and remains in a downtrend.
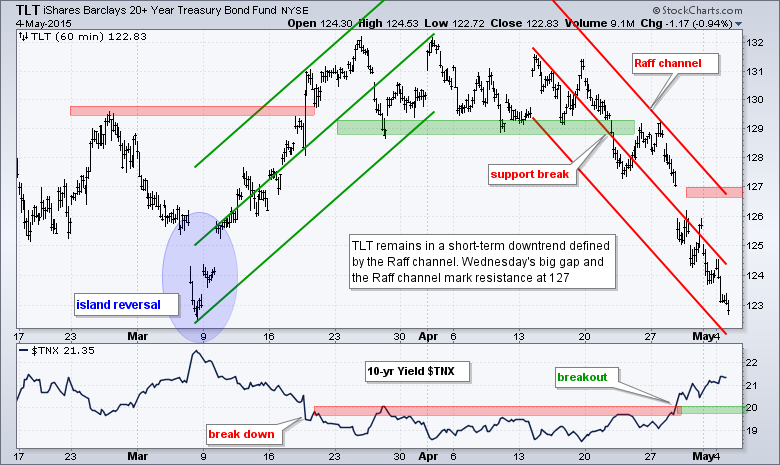
- TLT remains in a steep short-term downtrend heading into this week's employment report.
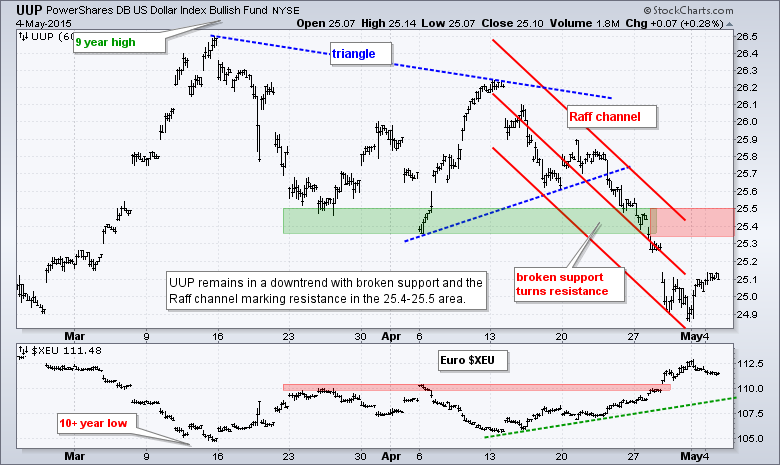
- UUP remains in a short-term downtrend.
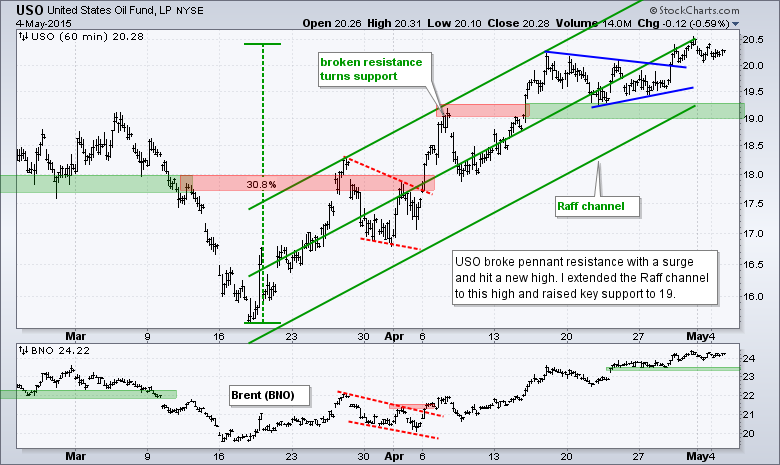
- USO broke pennant resistance and remains in an uptrend.
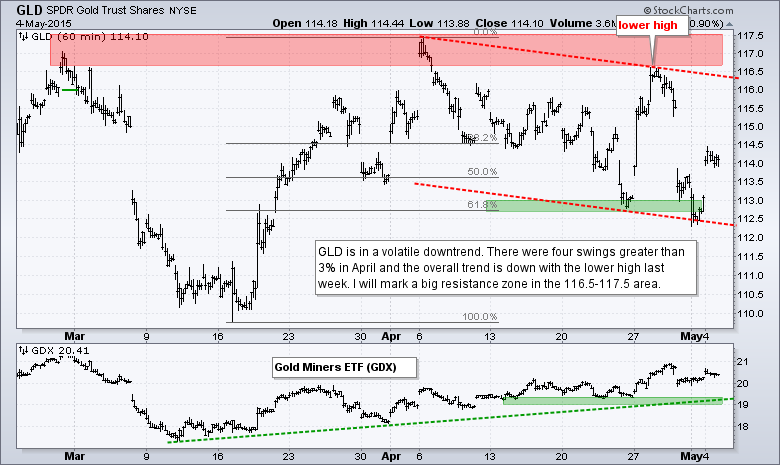
- GLD is in a volatile short-term downtrend.
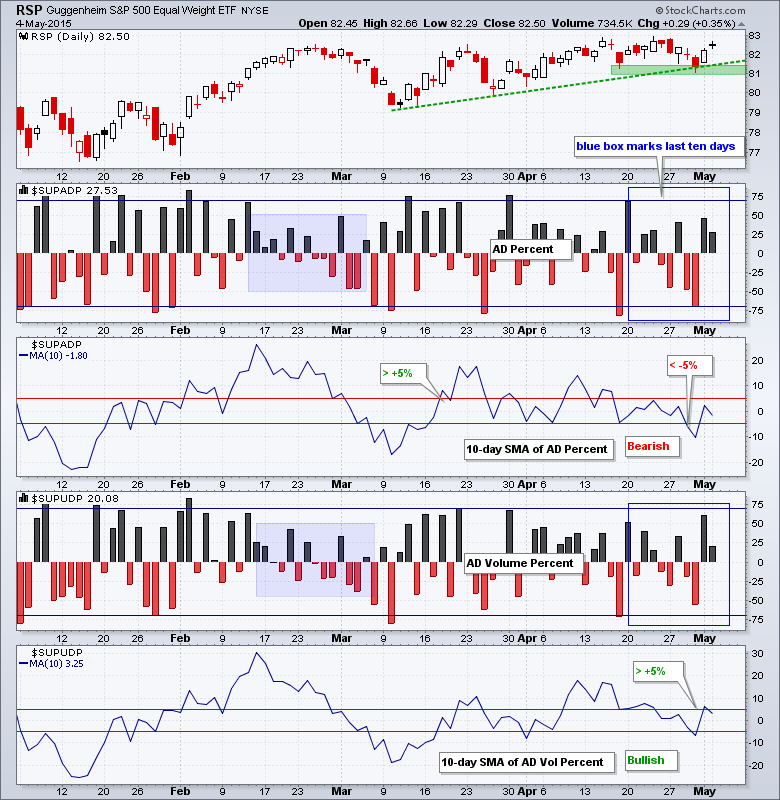
The Equal-Weight S&P 500 ETF (RSP) opened strong on Monday and then stalled to form a doji, which is an indecisive candlestick. There is no change in the uptrend and support remains in the 81-81.5 area. AD Percent and AD Volume Percent finished mildly positive. Notice that the long positive breadth bar from March 20th dropped out of the 10-day moving average and a smaller positive breadth bar was added. Overall, the 10-day SMAs are split with AD Percent bearish after a cross below -5% last week and AD Volume Percent bullish with a cross above +5% last Friday.
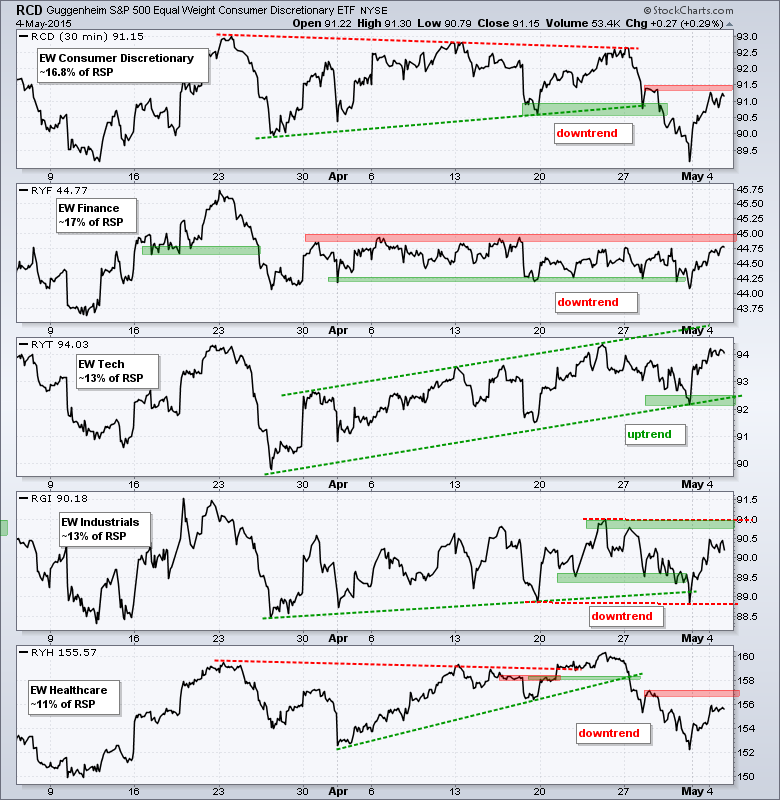
Four of the five equal-weight sector ETFs are in downtrends. The Equal-Weight Consumer Discretionary ETF (RCD), Equal-weight Finance ETF (RYF) and Equal-weight Industrials ETF (RGI) got big bounces the last two days, but I am not ready to call for uptrends. RCD is near its first resistance, RYF needs to break the April highs and RGI is in a choppy consolidation at best. The Equal-weight Technology ETF (RYT) is the only one in an uptrend and tech remains the strongest of the five.
**************************************************************
**************************************************************
**************************************************************
**************************************************************
**************************************************************
**************************************************************
**************************************************************
***************************************************************
Key Reports and Events (all times Eastern):
Mon - May 04 - 10:00 - Factory Orders
Tue - May 05 - 08:30 - Trade Balance
Tue - May 05 - 10:00 - ISM Services Index
Wed - May 06 - 07:00 - MBA Mortgage Index
Wed - May 06 - 08:15 - ADP Employment Report
Wed - May 06 - 10:30 - Crude Oil Inventories
Thu - May 07 - 07:30 - Challenger Job Report
Thu - May 07 - 08:30 - Initial Jobless Claims
Thu - May 07 - 10:30 - Natural Gas Inventories
Thu - May 07 - 15:00 - Consumer Credit
Fri - May 08 - 08:30 - Employment Report
Tue - May 12 - 00:00 - JOLTS
Wed - May 13 - 07:00 - MBA Mortgage Index
Wed - May 13 - 08:30 - Retail Sales
Wed - May 13 - 10:00 - Business Inventories
Wed - May 13 - 10:30 - Crude Oil Inventories
Thu - May 14 - 08:30 - Initial Jobless Claims
Thu - May 14 - 08:30 - Producer Price Index (PPI)
Thu - May 14 - 10:30 - Natural Gas Inventories
Fri - May 15 - 08:30 - Empire State Manufacturing
Fri - May 15 - 09:15 - Industrial Production
Fri - May 15 - 10:00 - Michigan Sentiment
Mon - May 18 - 10:00 - NAHB Housing Market Index
Tue - May 19 - 08:30 - Housing Starts/Building Permits
Wed - May 20 - 07:00 - MBA Mortgage Index
Wed - May 20 - 10:30 - Crude Oil Inventories
Wed - May 20 - 14:00 - FOMC Minutes
Thu - May 21 - 08:30 - Initial Jobless Claims
Thu - May 21 - 10:00 - Existing Home Sales
Thu - May 21 - 10:00 - Philadelphia Fed
Thu - May 21 - 10:00 - Leading Indicators
Thu - May 21 - 10:30 - Natural Gas Inventories
Fri - May 22 - 08:30 - Consumer Price Index (CPI)
Tue - May 26 - 08:30 - Durable Goods Orders
Tue - May 26 - 09:00 - Case-Shiller 20-city Index
Tue - May 26 - 09:00 - FHFA Housing Price Index
Tue - May 26 - 10:00 - New Home Sales
Tue - May 26 - 10:00 - Consumer Confidence
Wed - May 27 - 07:00 - MBA Mortgage Index
Thu - May 28 - 08:30 - Initial Jobless Claims
Thu - May 28 - 10:00 - Pending Home Sales
Thu - May 28 - 10:30 - Natural Gas Inventories
Thu - May 28 - 11:00 - Crude Oil Inventories
Fri - May 29 - 08:30 - GDP
Fri - May 29 - 09:45 - Chicago PMI
Fri - May 29 - 10:00 - Michigan Sentiment
This commentary is designed to stimulate thinking. This analysis is not a recommendation to buy, sell, hold or sell short any security (stock ETF or otherwise). We all need to think for ourselves when it comes to trading our own accounts. First, it is the only way to really learn. Second, we are the only ones responsible for our decisions. Think of these charts as food for further analysis. Before making a trade, it is important to have a plan. Plan the trade and trade the plan. Among other things, this includes setting a trigger level, a target area and a stop-loss level. It is also important to plan for three possible price movements: advance, decline or sideways. Have a plan for all three scenarios BEFORE making the trade. Consider possible holding times. And finally, look at overall market conditions and sector/industry performance.


