Stocks were hit with broad selling pressure on Tuesday with the Nasdaq 100 ETF (QQQ) leading the major index ETFs lower. All sectors were down with utilities getting hammered. Looks like XLU finally caught on to the rise in rates and followed the REIT iShares (IYR) lower. Techs were hit hard as the Semiconductor SPDR (XSD) fell over 2%. Banks held up well again as the Broker-Dealer iShares (IAI) and Regional Bank SPDR (KRE) only lost around .50%. The rise in Treasury yields and steepening yield curve are helping banks right now. The Metals & Mining SPDR (XME) also held up relatively well and declined just .07%. Note that the Steel ETF (SLX) was up almost 2%.
**This chart analysis is for educational purposes only, and should not
be construed as a recommendation to buy, sell or sell-short said securities**
Short-term Overview (Wednesday, 6-May-2015):
- Short-term breadth indicators are split.
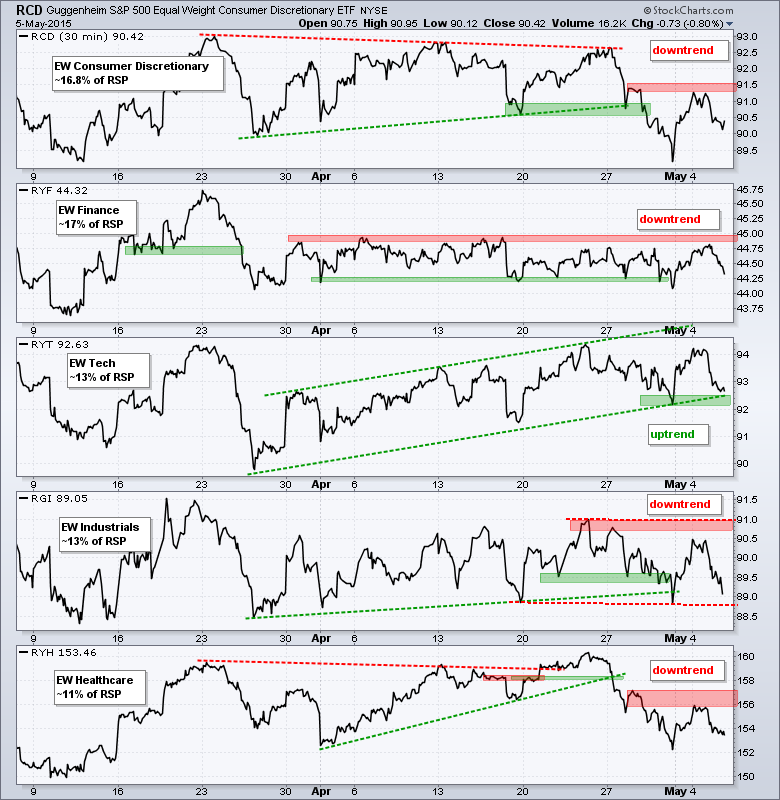
- Four of the five equal-weight sectors are in downtrends.
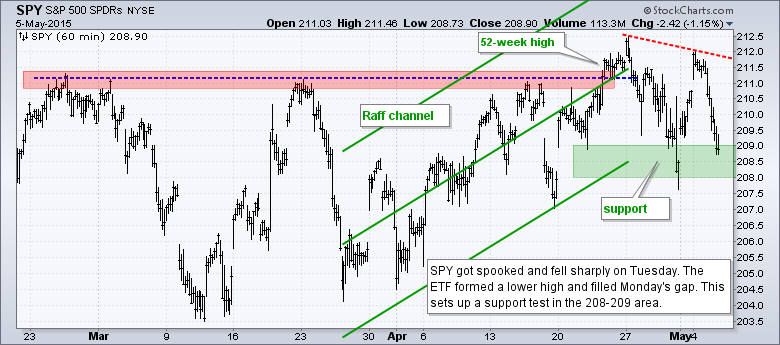
- SPY is testing key support after a sharp decline on Tuesday.
- QQQ formed a lower high and is testing uptrend support.
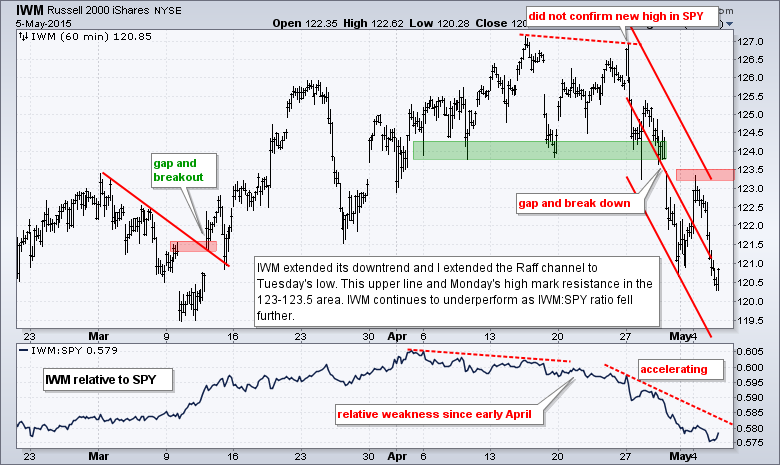
- IWM continued its downtrend in relative and absolute performance.
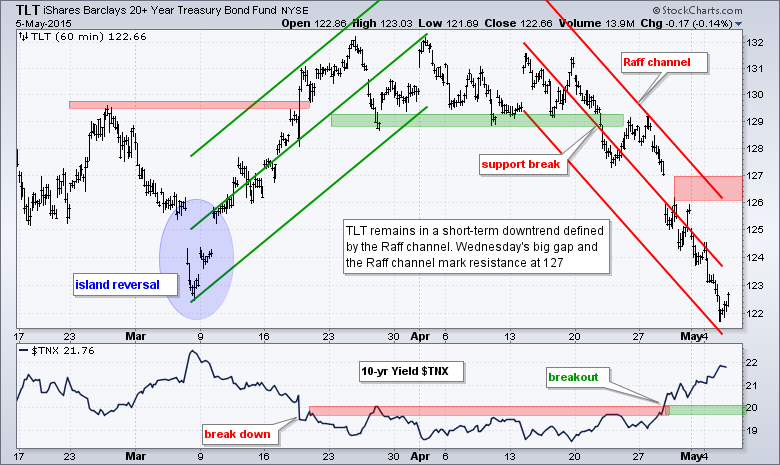
- TLT remains in a steep short-term downtrend heading into this week's employment report.
- UUP remains in a short-term downtrend.
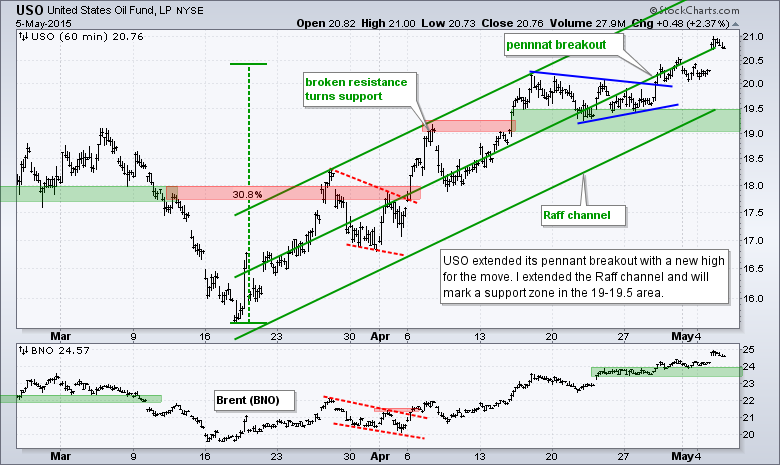
- USO broke pennant resistance last week and hit a new high for the move on Tuesday.
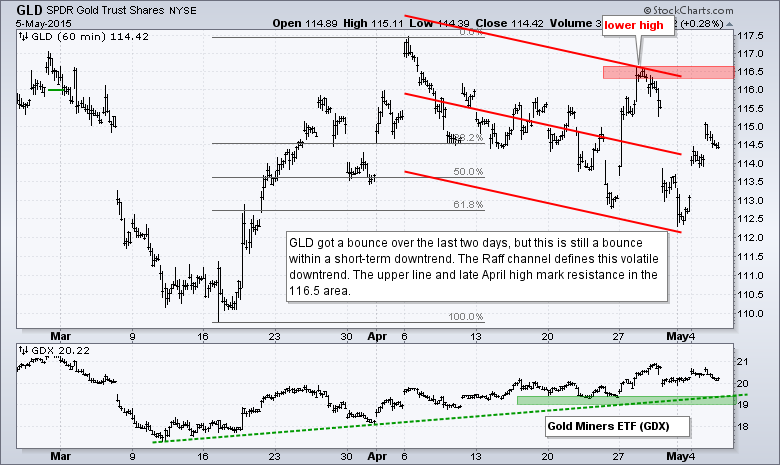
- GLD bounced, but remains in a volatile short-term downtrend.
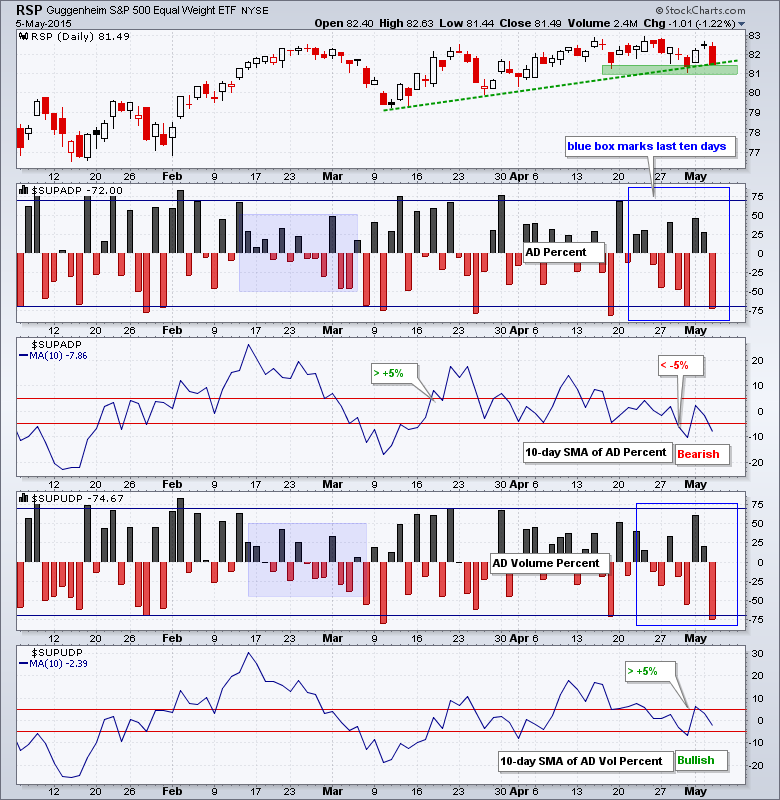
The Equal-Weight S&P 500 ETF (RSP) was hit with strong selling pressure on Tuesday and is now testing the rising trend line. The late April lows combine to mark support in the 80.5-81 area. AD Percent and AD Volume Percent finished with long red bars and big negative readings. Over the last 12 trading days, we have seen three dips below -65% and some strong selling pressure in small-caps. The 10-day SMA for AD Percent remains in bear mode. The 10-day SMA for AD Volume Percent, however, is still in bull mode. Another big down day would push this one below -5%.
Four of the five equal-weight sector ETFs are in downtrends. The Equal-Weight Consumer Discretionary ETF (RCD), Equal-weight Finance ETF (RYF) and Equal-weight Industrials ETF (RGI) broke down last week. These three bounced on Friday-Monday, but reversed on Tuesday and affirmed resistance levels. The Equal-weight Technology ETF (RYT) is the only sector in an uptrend and a support test is at hand.
**************************************************************
**************************************************************

**************************************************************
**************************************************************
**************************************************************

**************************************************************
**************************************************************
***************************************************************
Key Reports and Events (all times Eastern):
Wed - May 06 - 07:00 - MBA Mortgage Index
Wed - May 06 - 08:15 - ADP Employment Report
Wed - May 06 - 10:30 - Crude Oil Inventories
Thu - May 07 - 07:30 - Challenger Job Report
Thu - May 07 - 08:30 - Initial Jobless Claims
Thu - May 07 - 10:30 - Natural Gas Inventories
Thu - May 07 - 15:00 - Consumer Credit
Fri - May 08 - 08:30 - Employment Report
Tue - May 12 - 00:00 - JOLTS
Wed - May 13 - 07:00 - MBA Mortgage Index
Wed - May 13 - 08:30 - Retail Sales
Wed - May 13 - 10:00 - Business Inventories
Wed - May 13 - 10:30 - Crude Oil Inventories
Thu - May 14 - 08:30 - Initial Jobless Claims
Thu - May 14 - 08:30 - Producer Price Index (PPI)
Thu - May 14 - 10:30 - Natural Gas Inventories
Fri - May 15 - 08:30 - Empire State Manufacturing
Fri - May 15 - 09:15 - Industrial Production
Fri - May 15 - 10:00 - Michigan Sentiment
Mon - May 18 - 10:00 - NAHB Housing Market Index
Tue - May 19 - 08:30 - Housing Starts/Building Permits
Wed - May 20 - 07:00 - MBA Mortgage Index
Wed - May 20 - 10:30 - Crude Oil Inventories
Wed - May 20 - 14:00 - FOMC Minutes
Thu - May 21 - 08:30 - Initial Jobless Claims
Thu - May 21 - 10:00 - Existing Home Sales
Thu - May 21 - 10:00 - Philadelphia Fed
Thu - May 21 - 10:00 - Leading Indicators
Thu - May 21 - 10:30 - Natural Gas Inventories
Fri - May 22 - 08:30 - Consumer Price Index (CPI)
Tue - May 26 - 08:30 - Durable Goods Orders
Tue - May 26 - 09:00 - Case-Shiller 20-city Index
Tue - May 26 - 09:00 - FHFA Housing Price Index
Tue - May 26 - 10:00 - New Home Sales
Tue - May 26 - 10:00 - Consumer Confidence
Wed - May 27 - 07:00 - MBA Mortgage Index
Thu - May 28 - 08:30 - Initial Jobless Claims
Thu - May 28 - 10:00 - Pending Home Sales
Thu - May 28 - 10:30 - Natural Gas Inventories
Thu - May 28 - 11:00 - Crude Oil Inventories
Fri - May 29 - 08:30 - GDP
Fri - May 29 - 09:45 - Chicago PMI
Fri - May 29 - 10:00 - Michigan Sentiment
This commentary is designed to stimulate thinking. This analysis is not a recommendation to buy, sell, hold or sell short any security (stock ETF or otherwise). We all need to think for ourselves when it comes to trading our own accounts. First, it is the only way to really learn. Second, we are the only ones responsible for our decisions. Think of these charts as food for further analysis. Before making a trade, it is important to have a plan. Plan the trade and trade the plan. Among other things, this includes setting a trigger level, a target area and a stop-loss level. It is also important to plan for three possible price movements: advance, decline or sideways. Have a plan for all three scenarios BEFORE making the trade. Consider possible holding times. And finally, look at overall market conditions and sector/industry performance.
ı


