The S&P 500 opened strong and finished strong, and Thursday's close above 2120 was a new closing high for the index. The index has yet to hit an intraday high, but the trends are up and new intraday highs should follow. The rally was pretty broad-based, but the gains were relatively modest. IWM, SPY and DIA gained around 1%, while QQQ led with a 1.5% gain. The energy sector was the clear laggard as XLE fell a fraction. Strength in technology was across the board with the Internet ETF (FDN), Cloud Computing ETF (SKYY), Networking iShares (IGN), Semiconductor SPDR (XSD), Software iShares (IGV) and Biotech iShares (IBB) all gaining over 1%. Tech is still the place to be.
**This chart analysis is for educational purposes only, and should not
be construed as a recommendation to buy, sell or sell-short said securities**
Short-term Overview (Friday, 15-May-2015):
- Short-term breadth indicators are bullish.
- Four of the five equal-weight sectors are in uptrends.
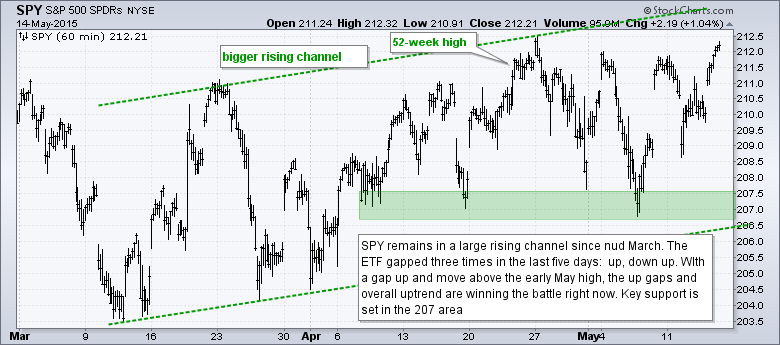
- SPY is challenging its highs and remains in a choppy uptrend.
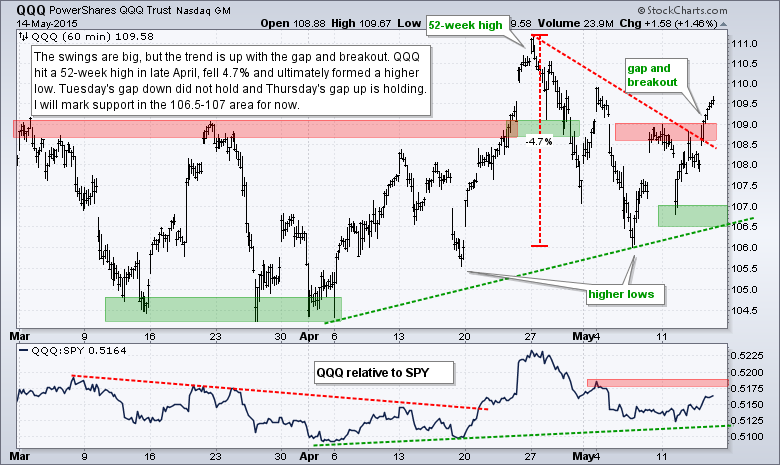
- QQQ gapped up and broke resistance to reverse the short-term downtrend.
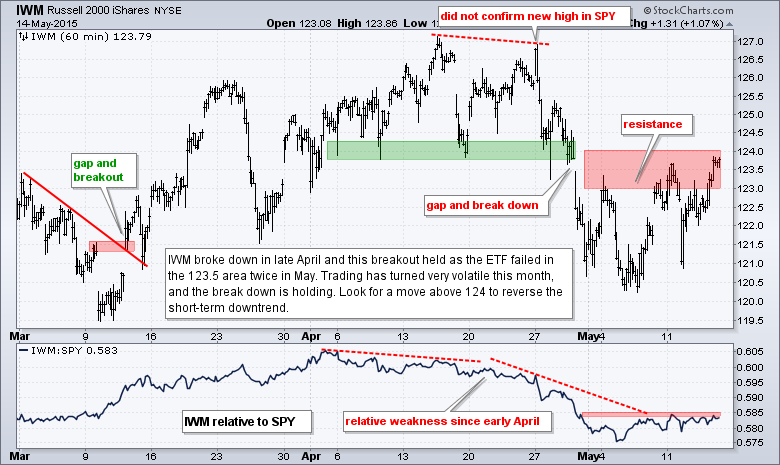
- IWM remains below its short-term support break (now resistance).
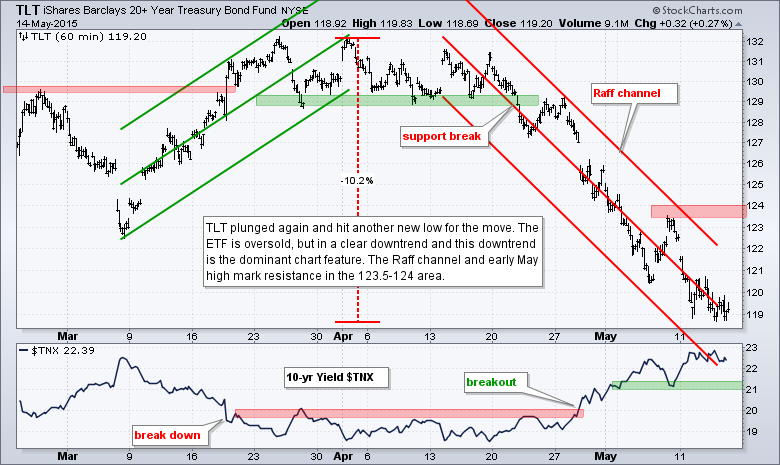
- TLT hit a new low for the move and remains in a short-term downtrend.
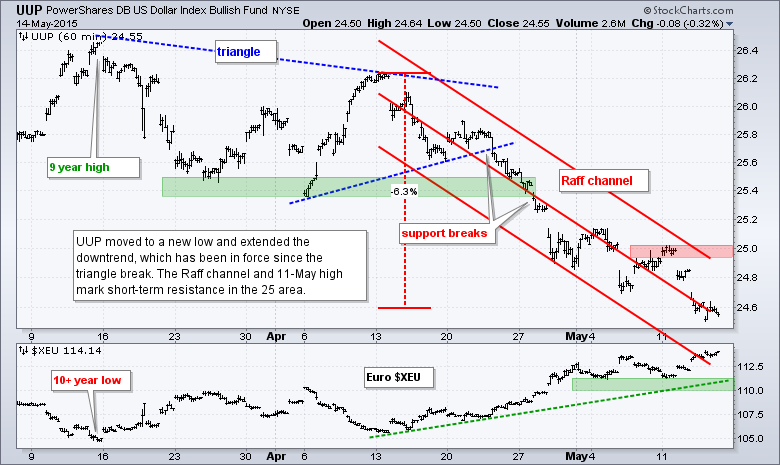
- UUP moved to new lows for the move and remains in a short-term downtrend.
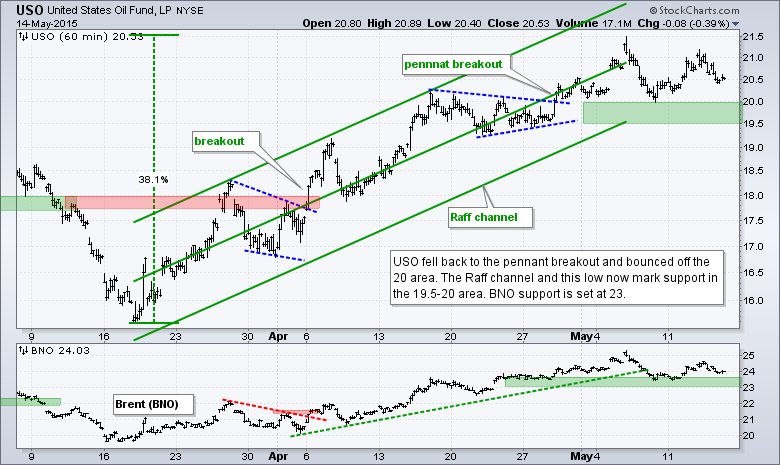
- USO remains above the pennant breakout zone and in a short-term uptrend.
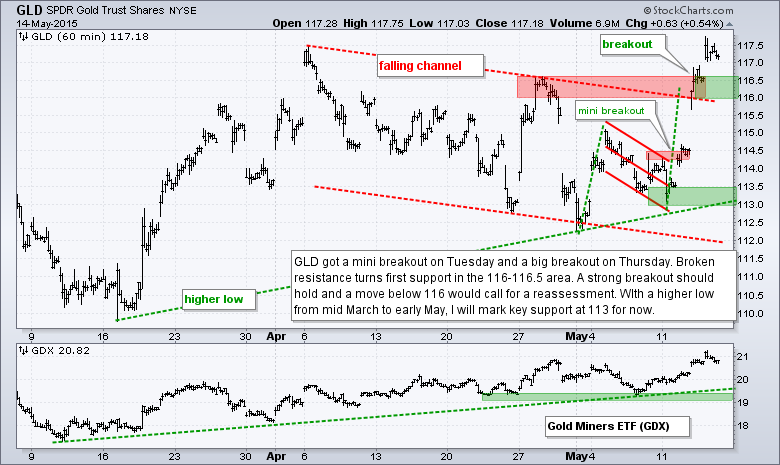
- GLD broke above its April highs to reverse the short-term downtrend.
The Equal-Weight S&P 500 ETF (RSP) gapped up last Friday, held this gap for the most part and followed through with a breakout at 82.50 on Thursday. This follow through move reverses the short-term downtrend and I will mark support at 81 for now.
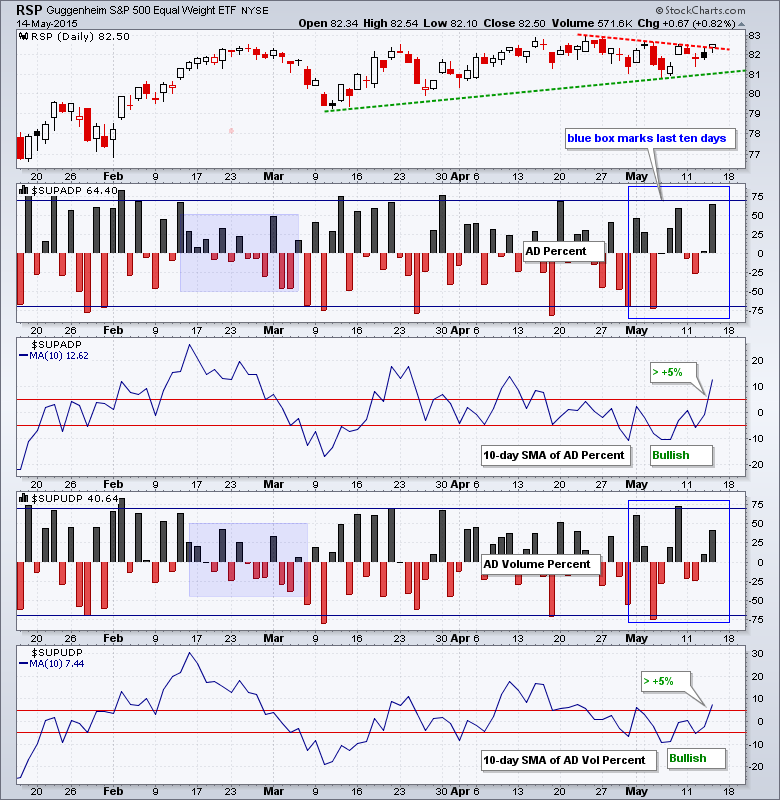
AD Percent surged to +64% and AD Volume Percent reached +40%. These readings are strong, but they do not represent a bullish breadth thrust. Nevertheless, the big negative values from April 30th were taken out of the 10-day SMA and Thursday's positive values were added. As a result, both 10-day SMAs surged above +5% to turn breadth bullish.
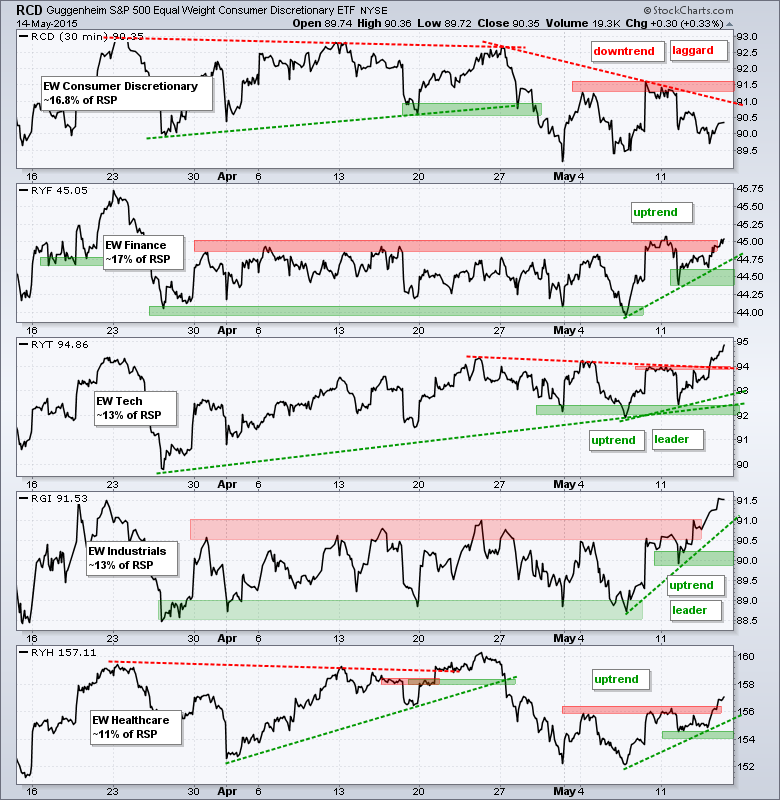
Four of the five equal-weight sector ETFs are in short-term uptrends. In fact, three of the five are trading at their highest levels of the month (May). The Equal-Weight Consumer Discretionary ETF (RCD) is the laggard and is not even close to a resistance breakout. The Equal-weight Technology ETF (RYT) and the Equal-weight Industrials ETF (RGI) are the leaders because both are trading above their April highs as well.
**************************************************************
**************************************************************
**************************************************************
**************************************************************
**************************************************************
**************************************************************
**************************************************************
***************************************************************
Key Reports and Events (all times Eastern):
Fri - May 15 - 08:30 - Empire State Manufacturing
Fri - May 15 - 09:15 - Industrial Production
Fri - May 15 - 10:00 - Michigan Sentiment
Mon - May 18 - 10:00 - NAHB Housing Market Index
Tue - May 19 - 08:30 - Housing Starts/Building Permits
Wed - May 20 - 07:00 - MBA Mortgage Index
Wed - May 20 - 10:30 - Crude Oil Inventories
Wed - May 20 - 14:00 - FOMC Minutes
Thu - May 21 - 08:30 - Initial Jobless Claims
Thu - May 21 - 10:00 - Existing Home Sales
Thu - May 21 - 10:00 - Philadelphia Fed
Thu - May 21 - 10:00 - Leading Indicators
Thu - May 21 - 10:30 - Natural Gas Inventories
Fri - May 22 - 08:30 - Consumer Price Index (CPI)
Tue - May 26 - 08:30 - Durable Goods Orders
Tue - May 26 - 09:00 - Case-Shiller 20-city Index
Tue - May 26 - 09:00 - FHFA Housing Price Index
Tue - May 26 - 10:00 - New Home Sales
Tue - May 26 - 10:00 - Consumer Confidence
Wed - May 27 - 07:00 - MBA Mortgage Index
Thu - May 28 - 08:30 - Initial Jobless Claims
Thu - May 28 - 10:00 - Pending Home Sales
Thu - May 28 - 10:30 - Natural Gas Inventories
Thu - May 28 - 11:00 - Crude Oil Inventories
Fri - May 29 - 08:30 - GDP
Fri - May 29 - 09:45 - Chicago PMI
Fri - May 29 - 10:00 - Michigan Sentiment
This commentary is designed to stimulate thinking. This analysis is not a recommendation to buy, sell, hold or sell short any security (stock ETF or otherwise). We all need to think for ourselves when it comes to trading our own accounts. First, it is the only way to really learn. Second, we are the only ones responsible for our decisions. Think of these charts as food for further analysis. Before making a trade, it is important to have a plan. Plan the trade and trade the plan. Among other things, this includes setting a trigger level, a target area and a stop-loss level. It is also important to plan for three possible price movements: advance, decline or sideways. Have a plan for all three scenarios BEFORE making the trade. Consider possible holding times. And finally, look at overall market conditions and sector/industry performance.


