It was a pretty wild week for stocks. The S&P 500 started weak with a 25 point decline and dip below 2090. This dip did not last long as the index surged back above 2115 on Thursday and hit an all time high on Friday. Yes, an all time high. Things cannot be that bad when the S&P 500 hits an all time high. Even though large-caps have been leading since early April, small-caps and mid-caps performed well last week. The Russell 2000 iShares (IWM) gained .82% and the S&P MidCap SPDR (MDY) advanced .88% and both outpaced the Dow Diamonds (+.57%) and the S&P 500 SPDR (+.39%).
**This chart analysis is for educational purposes only, and should not
be construed as a recommendation to buy, sell or sell-short said securities**
Short-term Overview (Monday, 18-May-2015):
- Short-term breadth indicators are bullish.
- Four of the five equal-weight sectors are in uptrends.
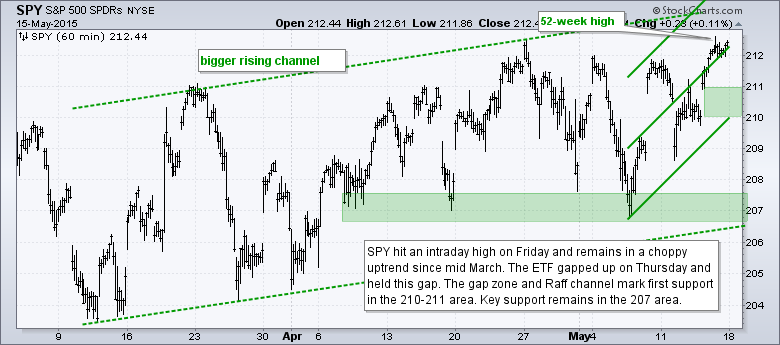
- SPY hit a new high and remains in a choppy uptrend.
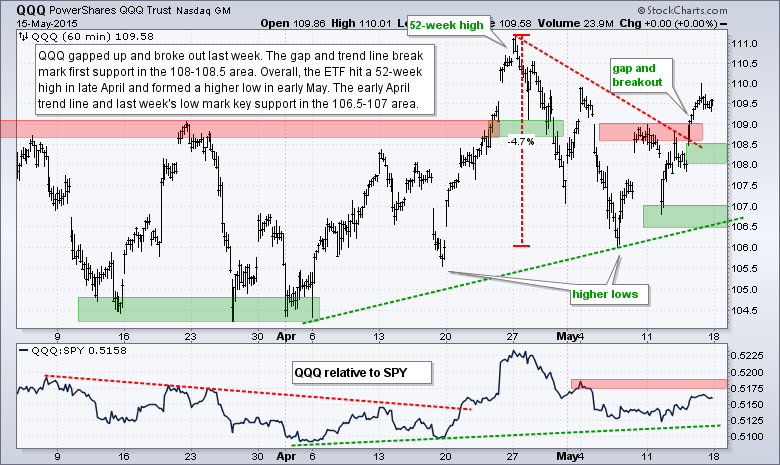
- QQQ broke out last week and remains in an uptrend.
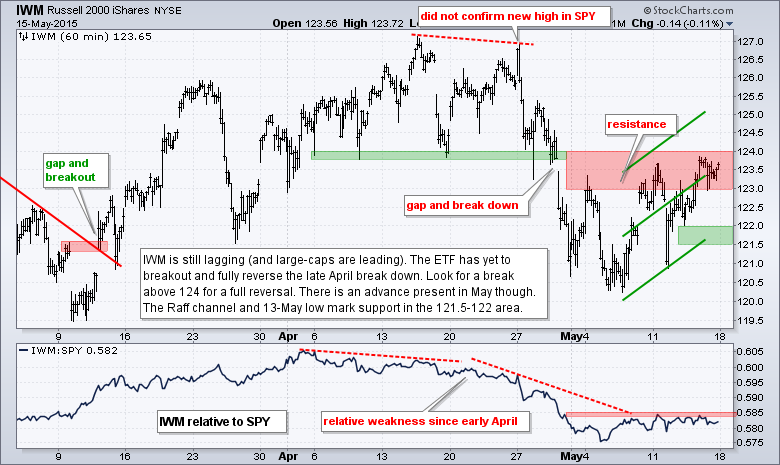
- IWM has yet to break out and remains below resistance.
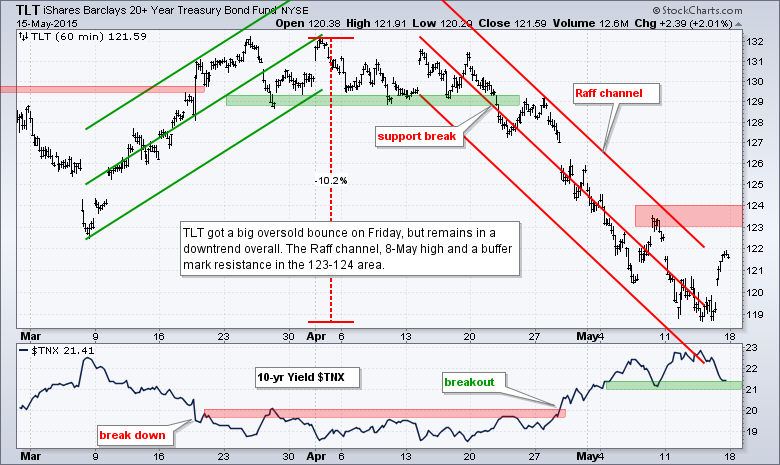
- TLT got a big oversold bounce, but remains in a downtrend overall.
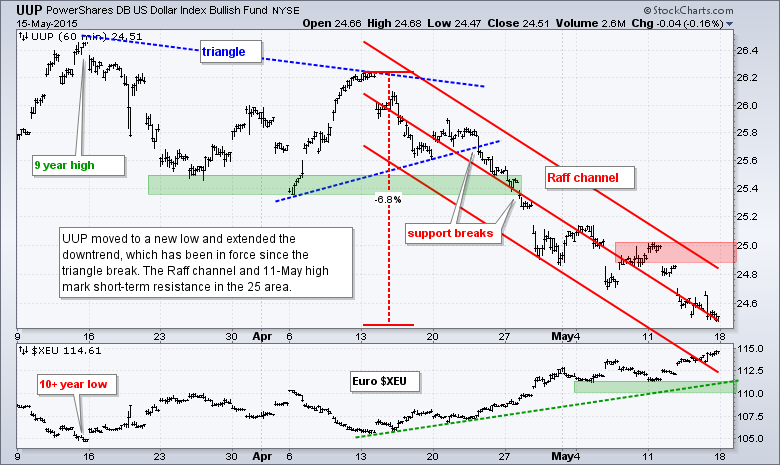
- UUP moved to new lows for the move and remains in a short-term downtrend.
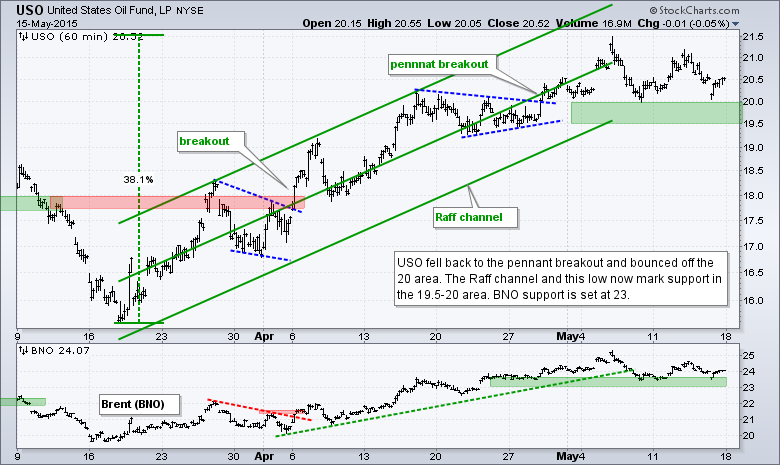
- USO remains above the pennant breakout zone and in a short-term uptrend.
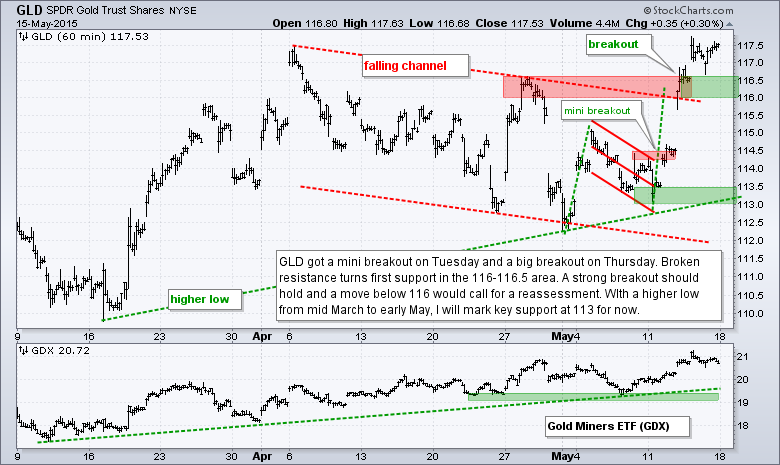
- GLD broke above its April highs to reverse the short-term downtrend.
The Equal-Weight S&P 500 ETF (RSP) broke above the red trend line last week and held this breakout on Friday. Note that RSP first broke above 82 in mid February and price action has been quite choppy the last few months. Nevertheless, there is a clear upward bias with new highs in April.
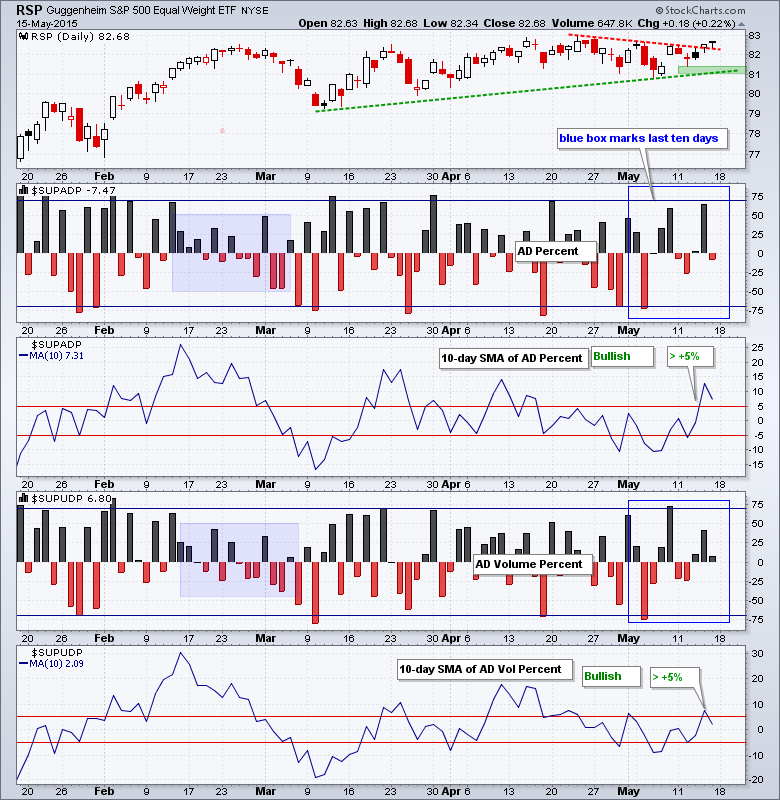
Breadth was mixed on Friday with AD Percent finishing slightly negative and AD Volume Percent finishing slightly positive. Overall, the 10-day SMAs crossed above +5% to turn bullish last week and breadth is bullish as long as both remain above -5%.
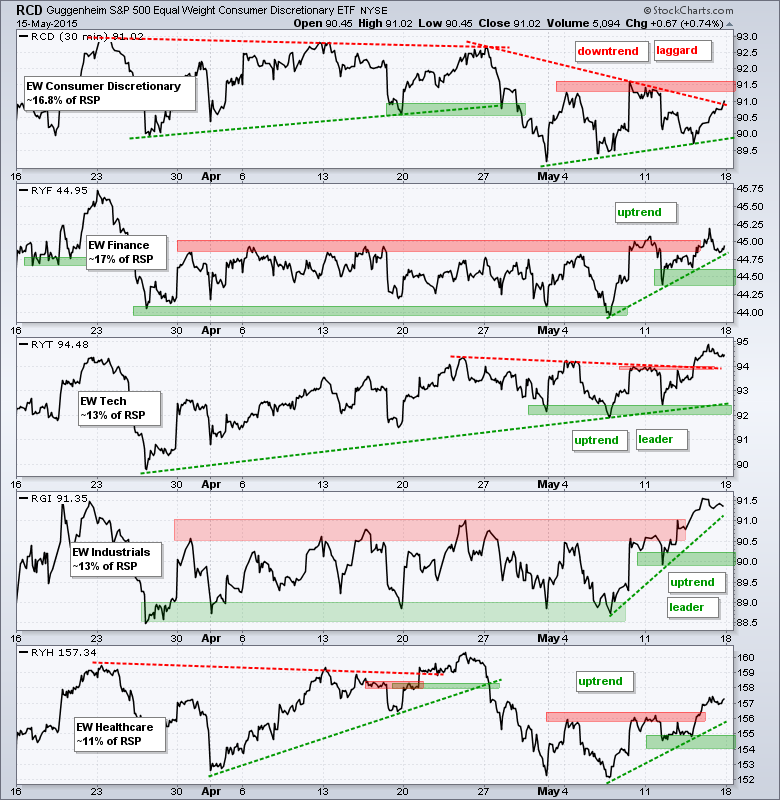
Four of the five equal-weight sector ETFs are in short-term uptrends. The Equal-Weight Consumer Discretionary ETF (RCD) remains the laggard because it has yet to break above the early May highs. The Equal-weight Technology ETF (RYT) and Equal-weight Industrials ETF (RGI) are the leaders because both exceeded their late March highs. Also notice how steep the advance was in RGI over the last seven days.
**************************************************************
**************************************************************
**************************************************************
**************************************************************
**************************************************************
**************************************************************
**************************************************************
***************************************************************
Key Reports and Events (all times Eastern):
Mon - May 18 - 10:00 - NAHB Housing Market Index
Tue - May 19 - 08:30 - Housing Starts/Building Permits
Wed - May 20 - 07:00 - MBA Mortgage Index
Wed - May 20 - 10:30 - Crude Oil Inventories
Wed - May 20 - 14:00 - FOMC Minutes
Thu - May 21 - 08:30 - Initial Jobless Claims
Thu - May 21 - 10:00 - Existing Home Sales
Thu - May 21 - 10:00 - Philadelphia Fed
Thu - May 21 - 10:00 - Leading Indicators
Thu - May 21 - 10:30 - Natural Gas Inventories
Fri - May 22 - 08:30 - Consumer Price Index (CPI)
Tue - May 26 - 08:30 - Durable Goods Orders
Tue - May 26 - 09:00 - Case-Shiller 20-city Index
Tue - May 26 - 09:00 - FHFA Housing Price Index
Tue - May 26 - 10:00 - New Home Sales
Tue - May 26 - 10:00 - Consumer Confidence
Wed - May 27 - 07:00 - MBA Mortgage Index
Thu - May 28 - 08:30 - Initial Jobless Claims
Thu - May 28 - 10:00 - Pending Home Sales
Thu - May 28 - 10:30 - Natural Gas Inventories
Thu - May 28 - 11:00 - Crude Oil Inventories
Fri - May 29 - 08:30 - GDP
Fri - May 29 - 09:45 - Chicago PMI
Fri - May 29 - 10:00 - Michigan Sentiment
This commentary is designed to stimulate thinking. This analysis is not a recommendation to buy, sell, hold or sell short any security (stock ETF or otherwise). We all need to think for ourselves when it comes to trading our own accounts. First, it is the only way to really learn. Second, we are the only ones responsible for our decisions. Think of these charts as food for further analysis. Before making a trade, it is important to have a plan. Plan the trade and trade the plan. Among other things, this includes setting a trigger level, a target area and a stop-loss level. It is also important to plan for three possible price movements: advance, decline or sideways. Have a plan for all three scenarios BEFORE making the trade. Consider possible holding times. And finally, look at overall market conditions and sector/industry performance.
