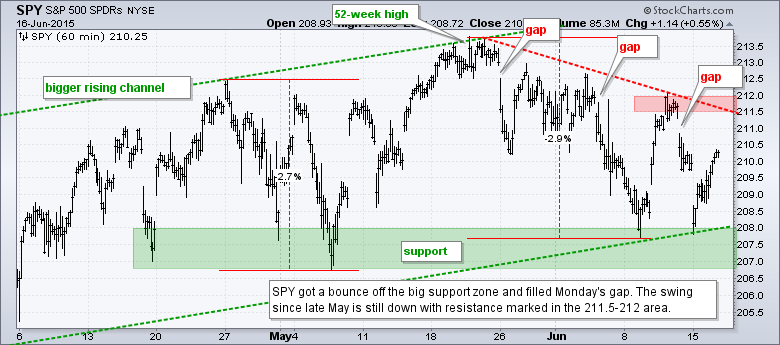
June has been anything but dull for the stock market, on a short-term basis at least. SPY sports three swings of at least 2% over the last ten days. After gapping down on Monday, stocks firmed and rallied from Monday morning to Tuesday afternoon. Tuesday's bounce was enough to fill Monday's gap and suggest that Greece is not a huge issue for the US stock market. Overall, the major index ETFs posted modest gains on the day. All sectors were up with consumer staples leading. The Home Construction iShares (ITB) weakened after housing starts and building permits were reported. Within technology, the Cyber Security ETF (HACK) and Software iShares (IGV) gained over 1% to lead. Banks continued strong as the Regional Bank SPDR (KRE) gained around 1%. Metals, mining and steel stocks were weak overall. The Copper Miners ETF (COPX) and Gold Miners ETF (GDX) fell over 1%, while the Metals & Mining SPDR (XME) and Steel ETF (SLX) edged lower. Today is Fed day with a policy statement due in the afternoon. Traders, therefore, should prepare for a little extra volatility before and after the statement.
**This chart analysis is for educational purposes only, and should not
be construed as a recommendation to buy, sell or sell-short said securities**
Short-term Overview (Wednesday, 17-June-2015):
- Short-term breadth remains bearish overall.
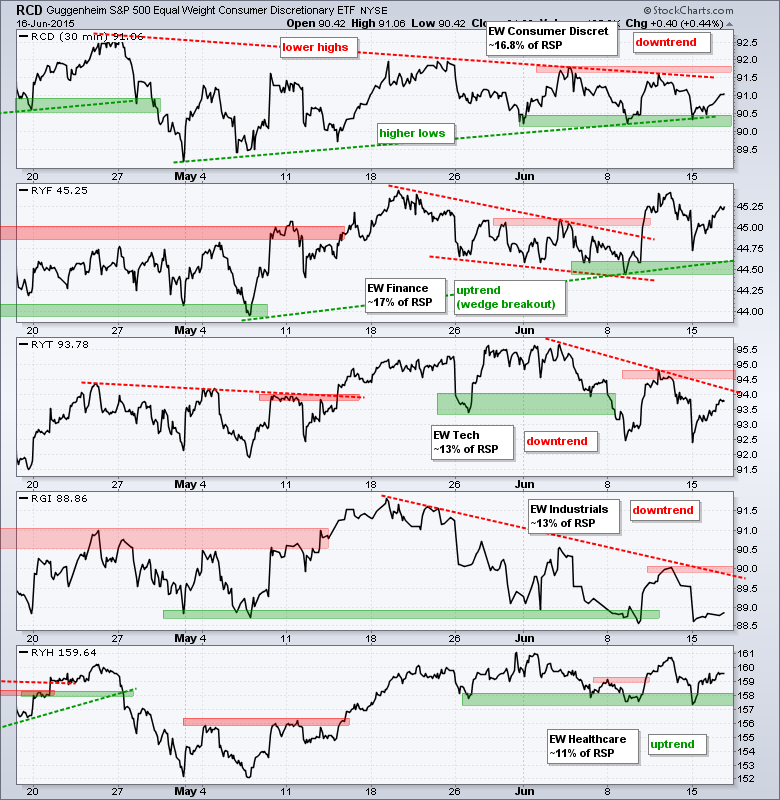
- Two of five EW sectors are in short-term downtrends and two are flat.
- SPY formed its third lower high with its third gap and remains in a downswing.
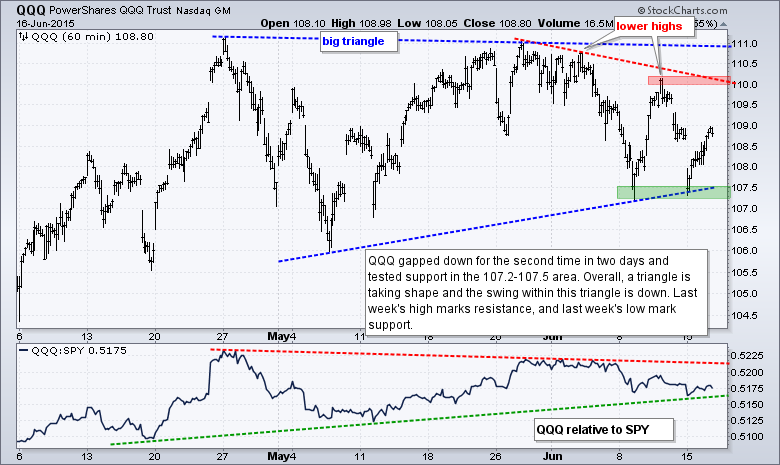
- QQQ bounced off triangle support and remains in a narrowing consolidation.
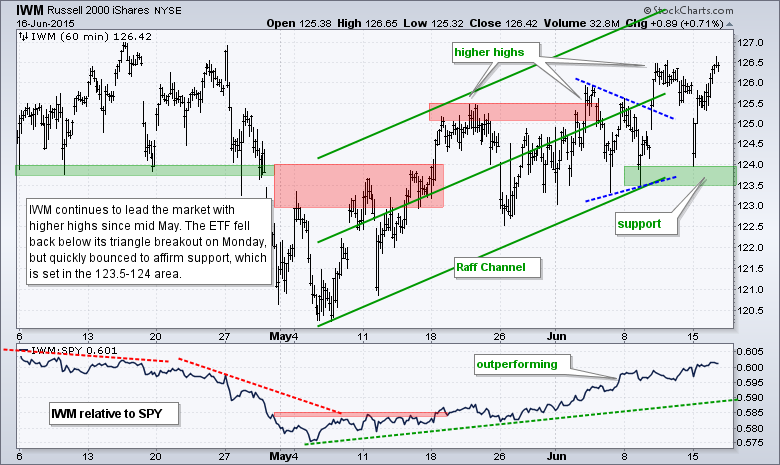
- IWM surged off support and remains in an uptrend.
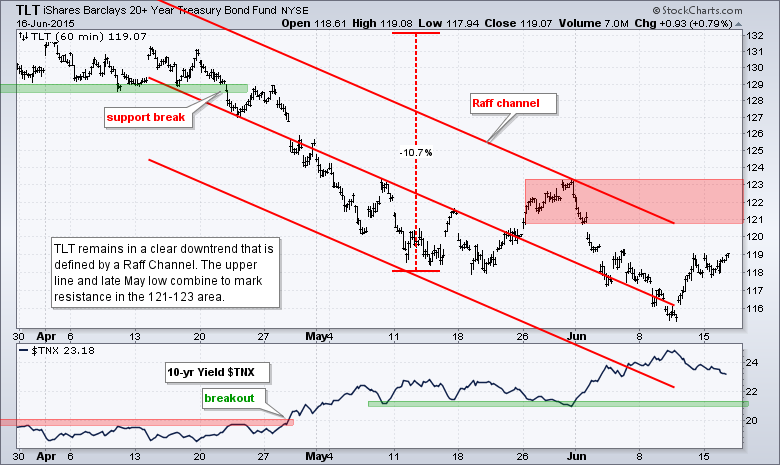
- TLT got an oversold bounce, but remains in a downtrend overall.
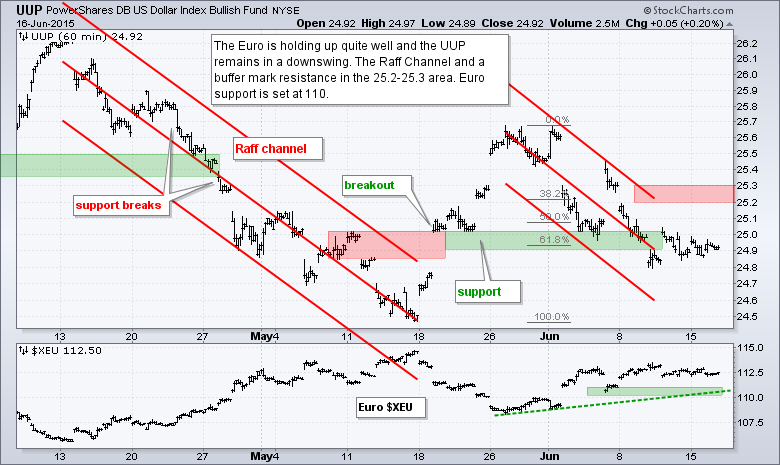
- UUP is firming with a narrow range, but remains in a short-term downtrend.
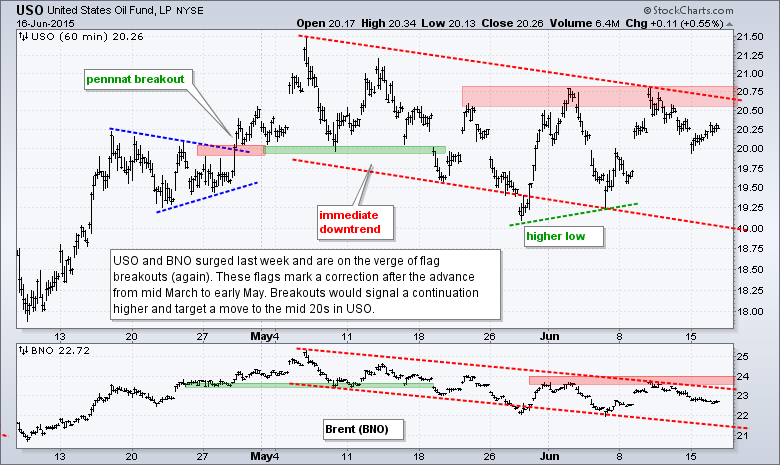
- USO remains in a short-term downtrend that looks like a bull flag.
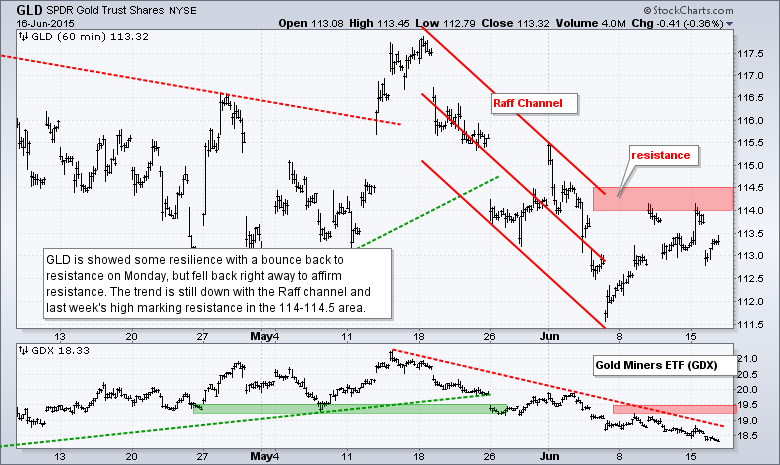
- GLD fell back from resistance and remains in a short-term downtrend.
The Equal-Weight S&P 500 ETF (RSP) firmed after the gap down on Monday and bounced on Tuesday with pretty good price action. Notice that a hollow black candlestick formed. This means the ETF opened near the low of the day and closed near the high. The gap has been filled and a follow thru break above 82 would reverse the short-term downtrend.
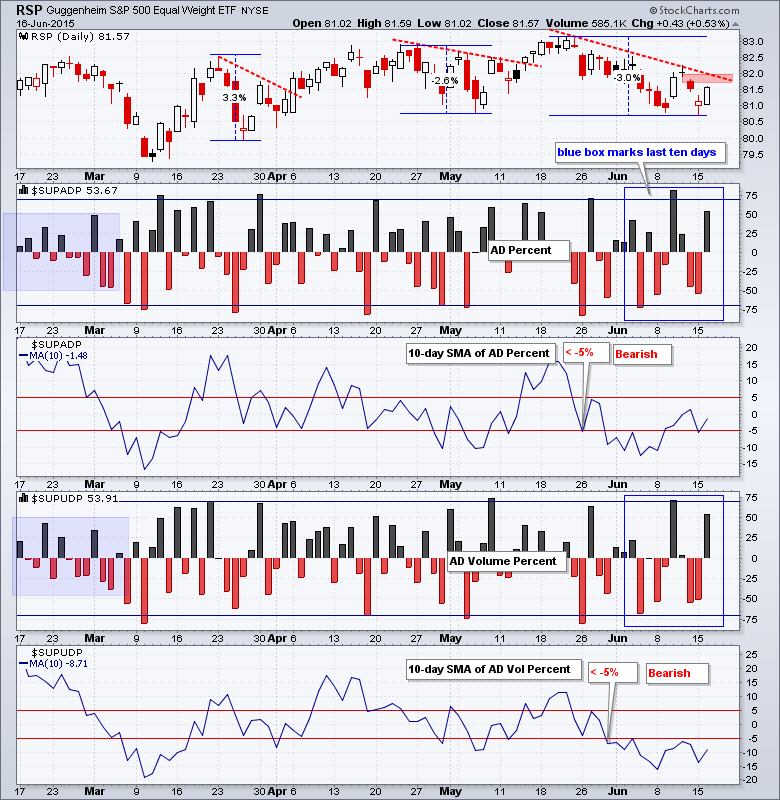
Breadth has improved over the last five days, but remains bearish overall. AD Percent and AD Volume Percent exceeded +50% for the second time in five days. These two were also positive for the third time in five days. Overall, I use the 10-day SMAs to filter out some noise and these two remain in negative territory. A break into positive territory is the earliest we can get for a bullish signal. A break above +5% is needed to show decent buying pressure and turn these indicators short-term bullish.
The sector balance is mixed. Two sector ETFs are in clear downtrends (Equal-weight Technology ETF (RYT) and Equal-weight Industrials ETF (RGI). RGI is the weakest of the sectors right now. The Equal-weight Finance ETF (RYF) is the only one in a clear uptrend after the breakout last week. The Equal-Weight Consumer Discretionary ETF (RCD) remains within a narrowing range and a breakout is looming, one way or the other. The Equal-weight Healthcare ETF (RYH) has been flat since late May, but the trend is up because support held.
**************************************************************
**************************************************************
**************************************************************
**************************************************************
**************************************************************
**************************************************************
**************************************************************
***************************************************************
Key Reports and Events (all times Eastern):
Wed - Jun 17 - 07:00 - MBA Mortgage Index
Wed - Jun 17 - 10:30 - Crude Oil Inventories
Wed - Jun 17 - 14:00 - FOMC Policy Statement
Thu - Jun 18 - 08:30 - Initial Jobless Claims
Thu - Jun 18 - 08:30 - Consumer Price Index (CPI)
Thu - Jun 18 - 10:00 - Philadelphia Fed
Thu - Jun 18 - 10:00 - Leading Economic Indicators
Thu - Jun 18 - 10:30 - Natural Gas Inventories
Mon - Jun 22 - 10:00 - Existing Home Sales
Tue - Jun 23 - 08:30 - Durable Goods Orders
Tue - Jun 23 - 09:00 - FHFA Housing Price Index
Tue - Jun 23 - 10:00 - New Home Sales
Wed - Jun 24 - 08:00 - EU Summit
Wed - Jun 24 - 07:00 - MBA Mortgage Index
Wed - Jun 24 - 08:30 - GDP
Wed - Jun 24 - 10:30 - Crude Oil Inventories
Thu - Jun 25 - 08:00 - EU Summit
Thu - Jun 25 - 08:30 - Initial Jobless Claims
Thu - Jun 25 - 08:30 - Personal Income & Spending
Thu - Jun 25 - 08:30 - PCE Prices
Thu - Jun 25 - 10:30 - Natural Gas Inventories
Fri - Jun 26 - 10:00 - Michigan Sentiment
This commentary is designed to stimulate thinking. This analysis is not a recommendation to buy, sell, hold or sell short any security (stock ETF or otherwise). We all need to think for ourselves when it comes to trading our own accounts. First, it is the only way to really learn. Second, we are the only ones responsible for our decisions. Think of these charts as food for further analysis. Before making a trade, it is important to have a plan. Plan the trade and trade the plan. Among other things, this includes setting a trigger level, a target area and a stop-loss level. It is also important to plan for three possible price movements: advance, decline or sideways. Have a plan for all three scenarios BEFORE making the trade. Consider possible holding times. And finally, look at overall market conditions and sector/industry performance.


