Stocks were mixed on Wednesday with QQQ and SPY posting small gains, and IWM and MDY posting small losses. The sectors were mixed with small gains coming in consumer discretionary, materials and consumer staples. The beaten down utilities sector got the biggest bounce, but it remains in a downtrend overall. The Cyber Security ETF (HACK) was the star in the technology sector with another 1+ percent gain. The ETF also surpassed the $1 billion mark for assets. The Regional Bank SPDR (KRE) and Bank SPDR (KBE) took a breather and fell over 1%. This is probably a buy-the-rumor (Fed tightening) and sell-the-news (Fed statement) situation. Banks rallied into the Fed meeting and then sold off afterwards. The Biotech SPDR (XBI) continues as one of the strongest groups as the ETF gained over 1% and neared another new high.
**This chart analysis is for educational purposes only, and should not
be construed as a recommendation to buy, sell or sell-short said securities**
Short-term Overview (Thursday, 18-June-2015):
- Short-term breadth remains bearish overall.
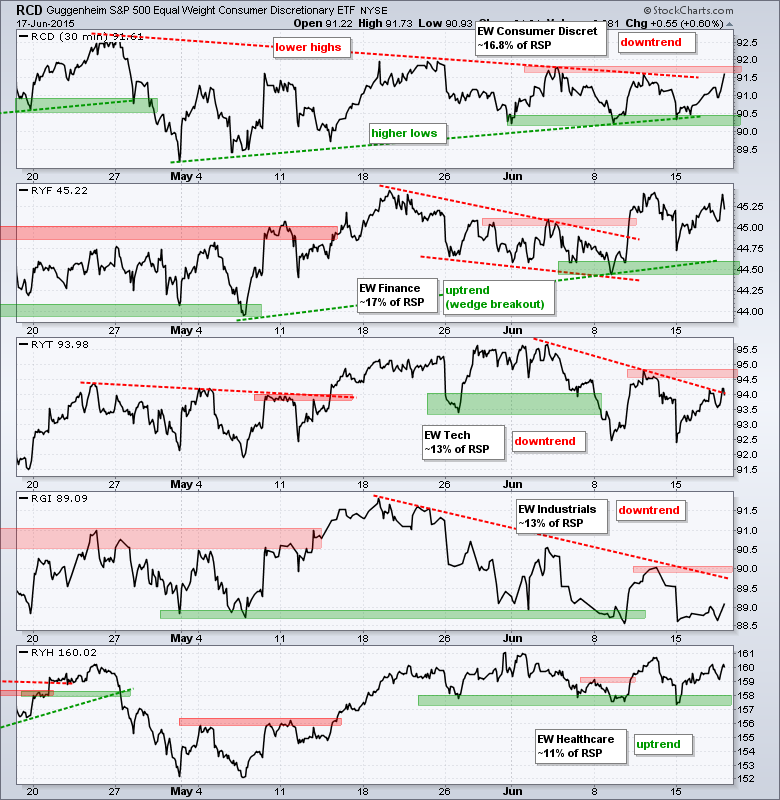
- Two of the five EW sectors are in short-term downtrends and two are flat.
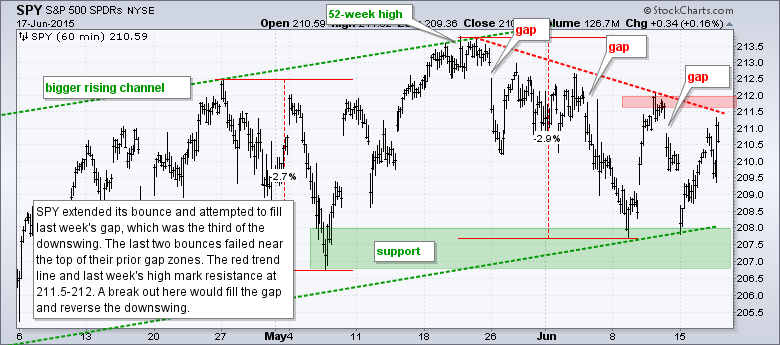
- SPY remains in a downswing with three gaps and lower highs.
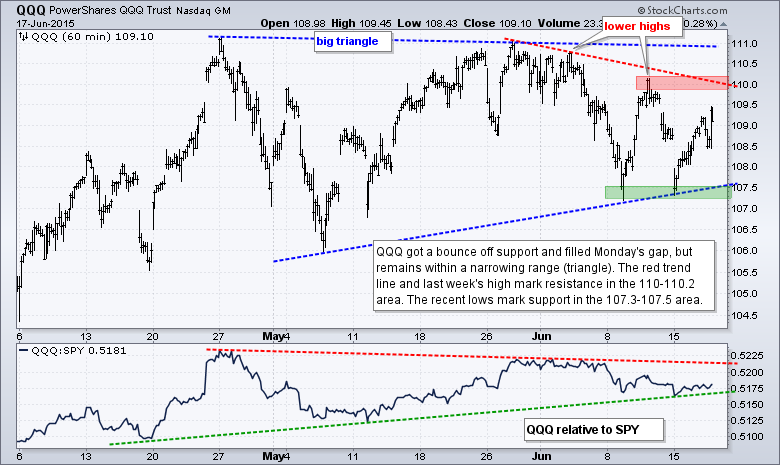
- QQQ bounced off triangle support and remains in a narrowing consolidation.
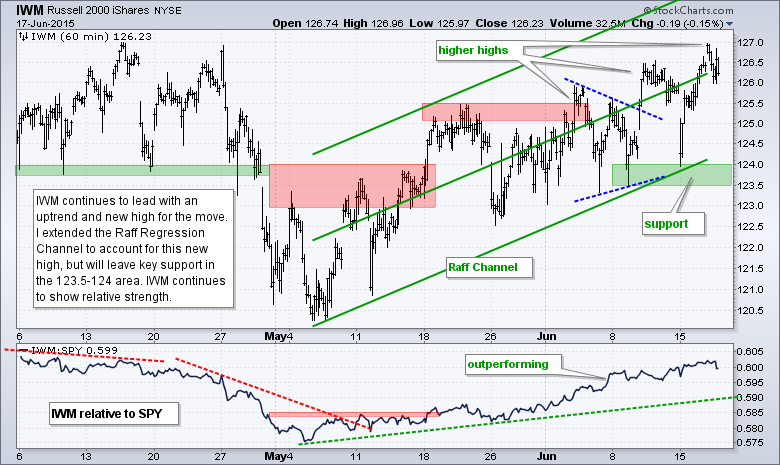
- IWM hit a new high for the move and remains in a short-term uptrend.
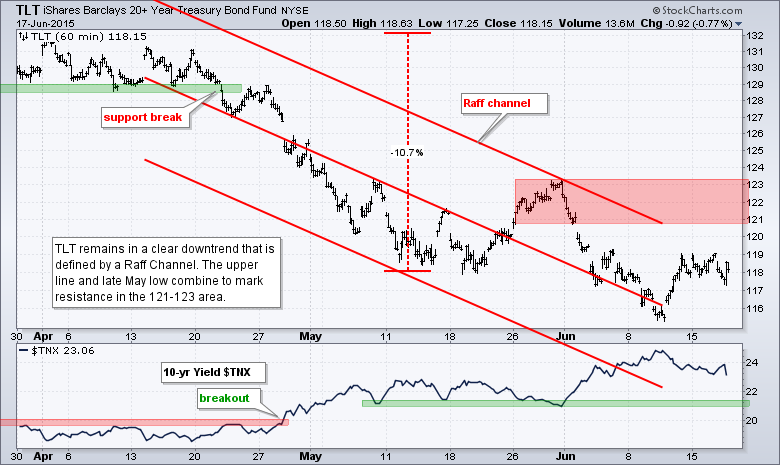
- TLT got an oversold bounce, but remains in a downtrend overall.
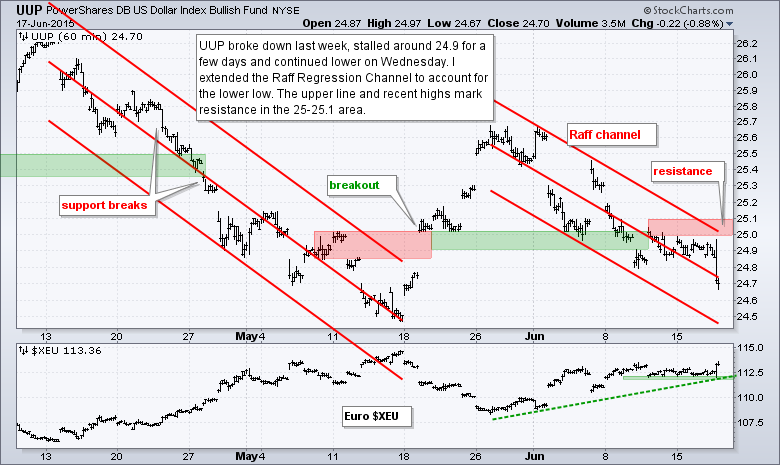
- UUP fell after the Fed announcement and remains in a short-term downtrend.
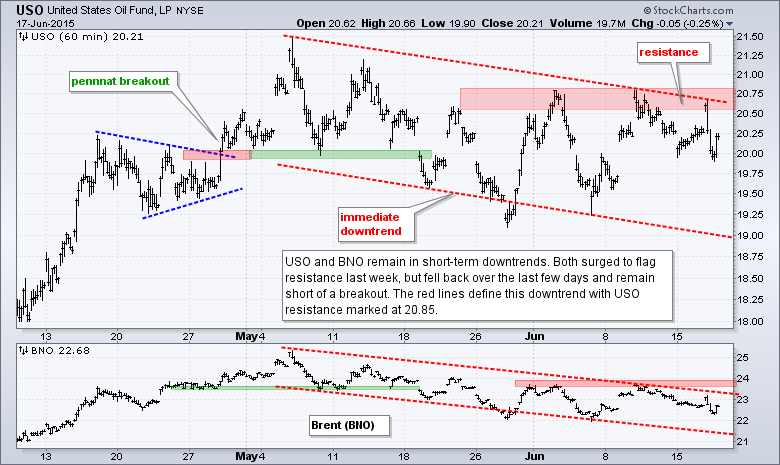
- USO remains in a short-term downtrend that looks like a bull flag.
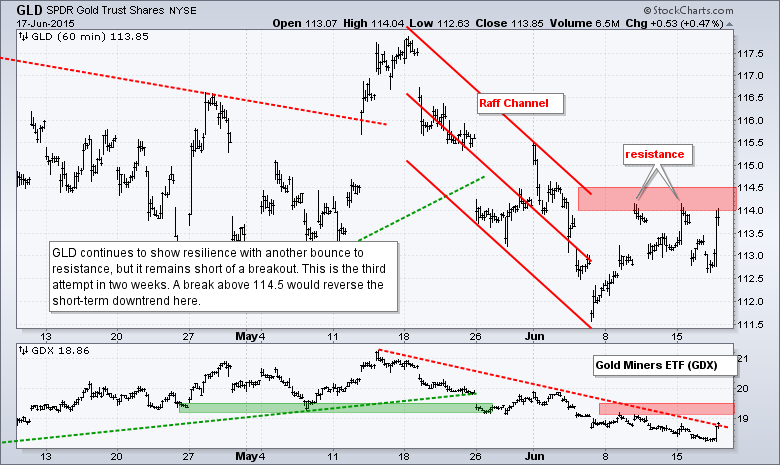
- GLD surged to short-term resistance, but has yet to break out and reverse the short-term downtrend.
The Equal-Weight S&P 500 ETF (RSP) formed a doji at trend line resistance for the second time in as many weeks. This doji signals indecision because the open and close are equal. RSP opened at 81.76, moved up and down during the day, and then settled right back at the open (81.76). A little follow through to Wednesday's gain is needed for a breakout.
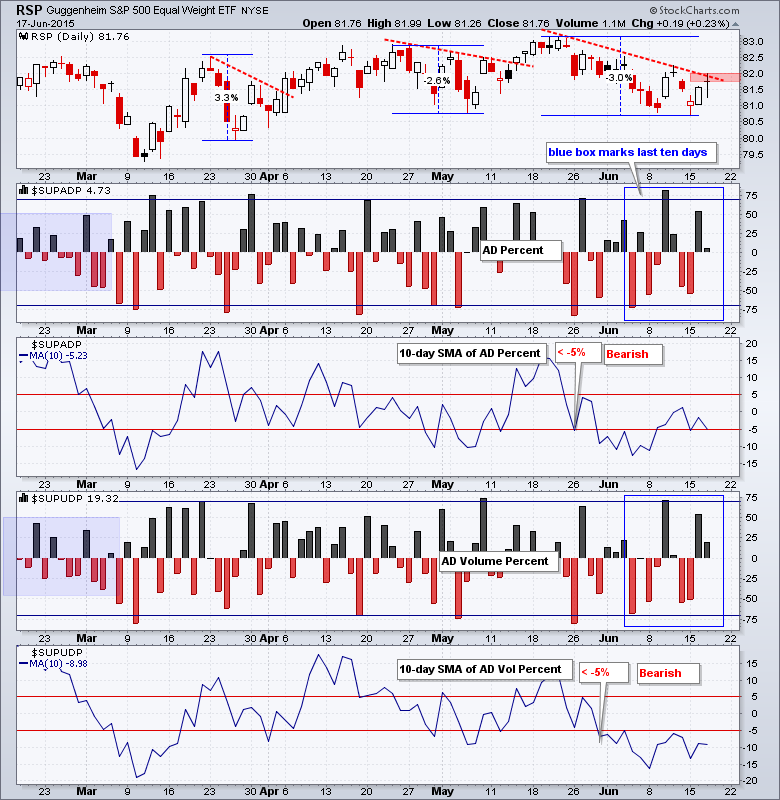
Breadth is slowly improving because AD Percent and AD Volume Percent have been positive for four of the last six days. Overall, however, breadth remains bearish because the 10-day SMAs remain in negative territory. At the very least, a move into positive territory is needed to tilt the balance back to the bulls. A move above +5% is needed to show decent buying pressure.
The top five equal-weight sectors remain mixed. The Equal-Weight Consumer Discretionary ETF (RCD) made a move towards resistance with a 1% gain from Monday's low to Wednesday's high. This is promising and a breakout would be bullish. The Equal-weight Finance ETF (RYF) remains the strongest of the five. The Equal-weight Healthcare ETF (RYH) is also holding up well and got a good bounce the last three days.
**************************************************************
**************************************************************
**************************************************************
**************************************************************
**************************************************************
**************************************************************
**************************************************************
***************************************************************
Key Reports and Events (all times Eastern):
Thu - Jun 18 - 08:30 - Initial Jobless Claims
Thu - Jun 18 - 08:30 - Consumer Price Index (CPI)
Thu - Jun 18 - 10:00 - Philadelphia Fed
Thu - Jun 18 - 10:00 - Leading Economic Indicators
Thu - Jun 18 - 10:30 - Natural Gas Inventories
Mon - Jun 22 - 10:00 - Existing Home Sales
Tue - Jun 23 - 08:30 - Durable Goods Orders
Tue - Jun 23 - 09:00 - FHFA Housing Price Index
Tue - Jun 23 - 10:00 - New Home Sales
Wed - Jun 24 - 08:00 - EU Summit
Wed - Jun 24 - 07:00 - MBA Mortgage Index
Wed - Jun 24 - 08:30 - GDP
Wed - Jun 24 - 10:30 - Crude Oil Inventories
Thu - Jun 25 - 08:00 - EU Summit
Thu - Jun 25 - 08:30 - Initial Jobless Claims
Thu - Jun 25 - 08:30 - Personal Income & Spending
Thu - Jun 25 - 08:30 - PCE Prices
Thu - Jun 25 - 10:30 - Natural Gas Inventories
Fri - Jun 26 - 10:00 - Michigan Sentiment
This commentary is designed to stimulate thinking. This analysis is not a recommendation to buy, sell, hold or sell short any security (stock ETF or otherwise). We all need to think for ourselves when it comes to trading our own accounts. First, it is the only way to really learn. Second, we are the only ones responsible for our decisions. Think of these charts as food for further analysis. Before making a trade, it is important to have a plan. Plan the trade and trade the plan. Among other things, this includes setting a trigger level, a target area and a stop-loss level. It is also important to plan for three possible price movements: advance, decline or sideways. Have a plan for all three scenarios BEFORE making the trade. Consider possible holding times. And finally, look at overall market conditions and sector/industry performance.


