Stocks moved up at the beginning of the week and down towards the end of the week. The end result was mixed for the major index ETFs as QQQ fell around .50% and IWM gained .42%. The sectors were mixed with finance showing strength and energy showing weakness. Strength in the finance sector is the current theme for the market. The Regional Bank SPDR (KRE), Bank SPDR (KBE) and Insurance SPDR (KIE) gained over 2% and all three hit 52-week highs last week. It is going to be another week full of marking-moving news. The Greek saga continues with yet another "deadline" on Thursday, which is when Euro-area finance ministers meet. This is just political brinkmanship and chartists would be better off totally ignoring all Greek-related headlines. More important to the US markets, the Fed meets on Tuesday-Wednesday to discuss policy and the potential for a future rate hike. The bond market is already pricing in a change in Fed policy so it is a question of when, not if.
**This chart analysis is for educational purposes only, and should not
be construed as a recommendation to buy, sell or sell-short said securities**
Short-term Overview (Monday, 15-June-2015):
- Short-term breadth is bearish, but there was an up thrust on Wednesday.
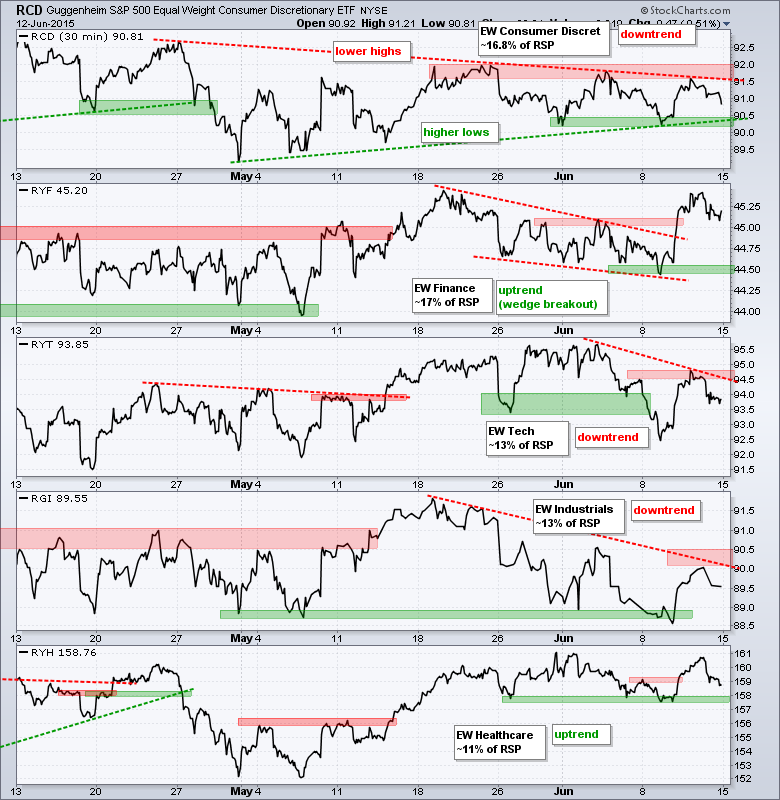
- Three of the five equal-weight sectors are in short-term downtrends.
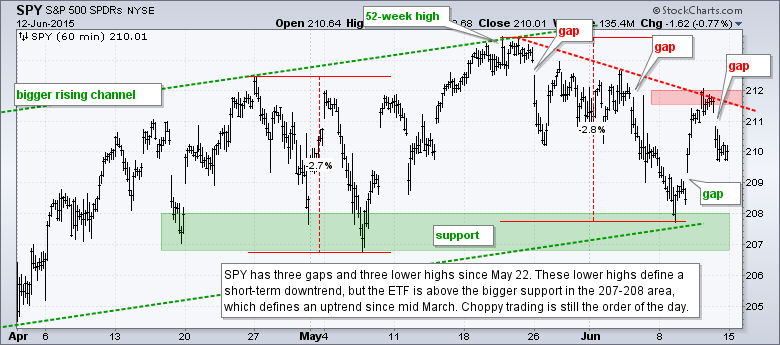
- SPY formed its third lower high with its third gap and remains in a downswing.
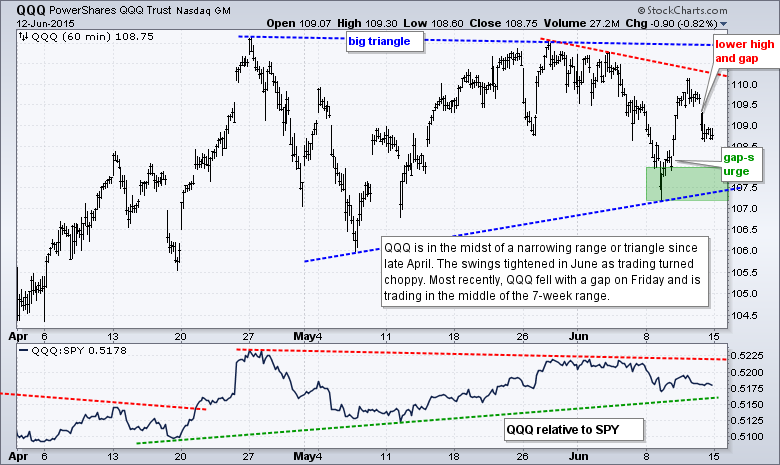
- QQQ is flat with a triangle taking shape since late April.
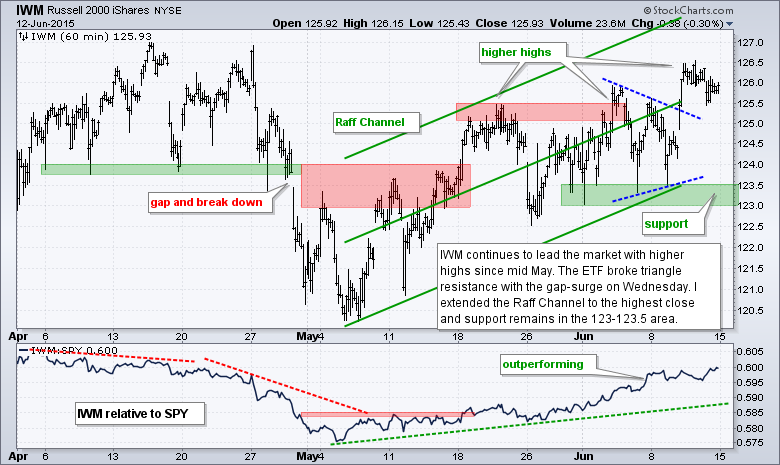
- IWM broke triangle resistance to extend its uptrend and shows relative strength.
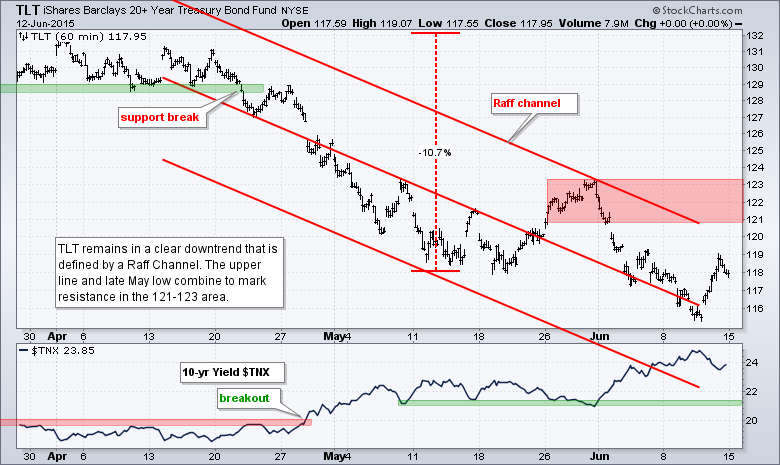
- TLT remains in a strong downtrend.
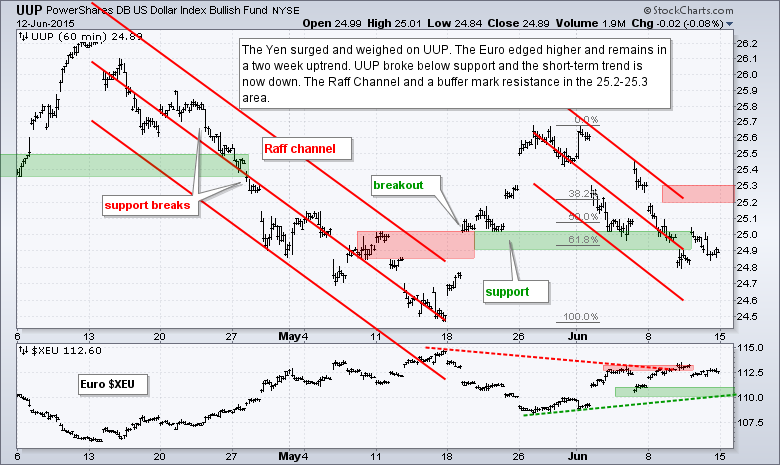
- UUP is in a short-term downtrend.
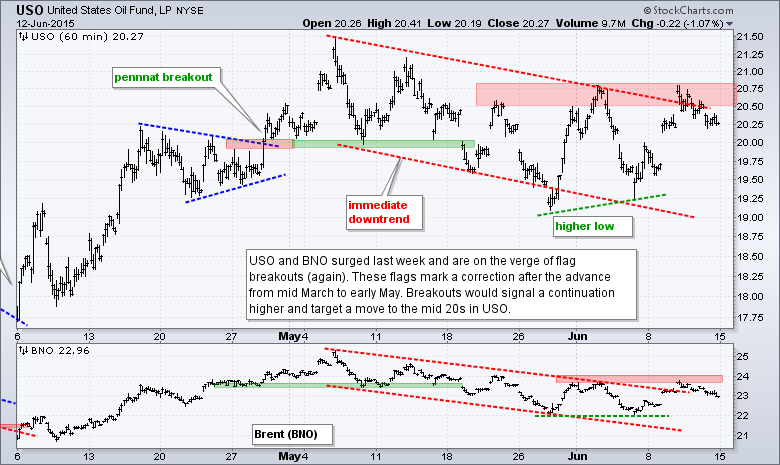
- USO is challenging resistance of a bull flag.
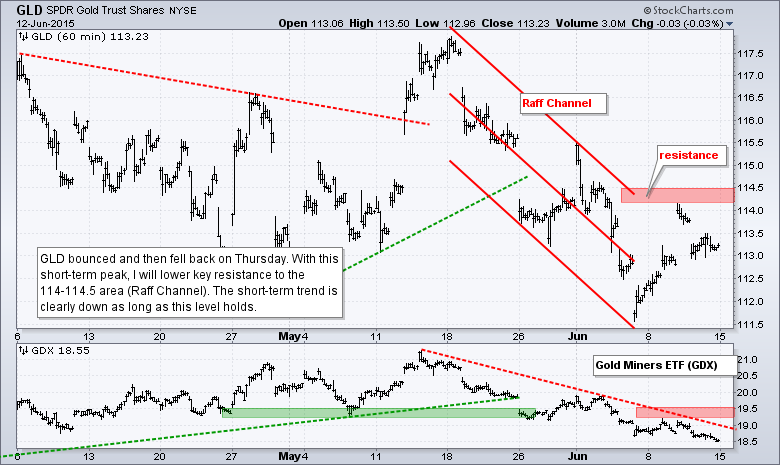
- GLD is in a short-term downtrend.
The Equal-Weight S&P 500 ETF (RSP) formed a doji at resistance on Thursday and backed off on Friday. The trend since late May is down, but still up since mid March. A break above 82.2 would reverse this downswing.
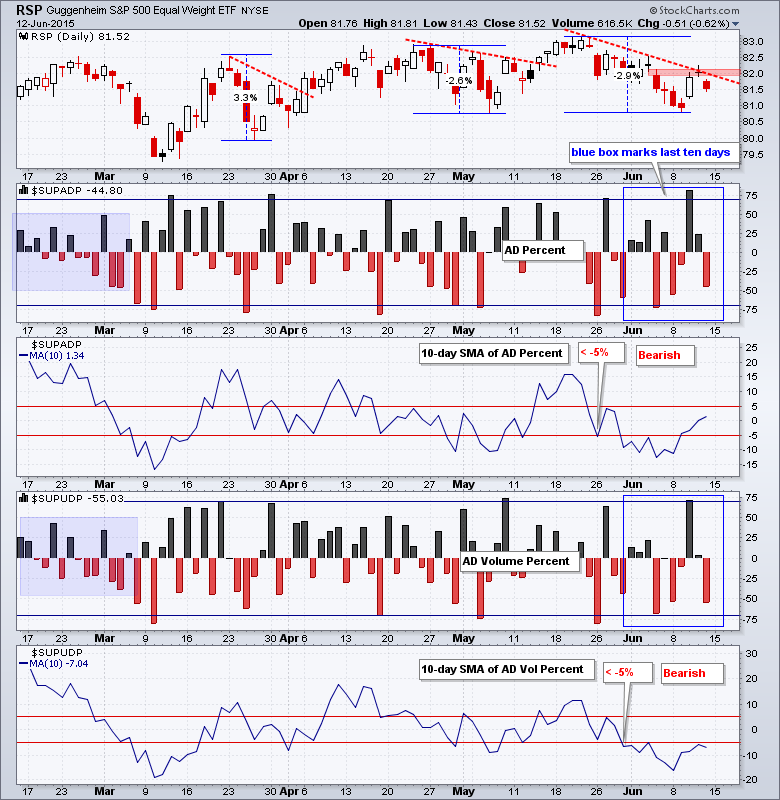
AD Percent and AD Volume Percent finished in negative territory as selling pressure picked up on Friday. AD Percent hit -45% and AD Volume Percent fell to -55%, which indicates more selling pressure in large-caps than small-caps. Overall, the 10-day SMAs have been bearish since late May and need to break +5% to turn bullish again.
Three of the five equal-weight sector ETFs are in downtrends. It is a mixed back that could go either way. Perhaps the Equal-Weight Consumer Discretionary ETF (RCD) should be watched the closest because this ETF is consolidating with a narrowing range. An upside breakout would be bullish and a downside break bearish. The Equal-weight Finance ETF (RYF) is the strongest after its wedge breakout and this breakout held. The Equal-weight Industrials ETF (RGI) continues to weigh with a downtrend since 19-May. The Equal-weight Technology ETF (RYT) has been reclassified as a downtrend because it fell back on Friday.
**************************************************************
**************************************************************
**************************************************************
**************************************************************
**************************************************************
**************************************************************
**************************************************************
***************************************************************
Key Reports and Events (all times Eastern):
Mon - Jun 15 - 08:30 - Empire State Manufacturing
Mon - Jun 15 - 09:15 - Industrial Production
Mon - Jun 15 - 10:00 - NAHB Housing Market Index
Tue - Jun 16 - 08:30 - Housing Starts & Building Permits
Wed - Jun 17 - 07:00 - MBA Mortgage Index
Wed - Jun 17 - 10:30 - Crude Oil Inventories
Wed - Jun 17 - 14:00 - FOMC Policy Statement
Thu - Jun 18 - 08:30 - Initial Jobless Claims
Thu - Jun 18 - 08:30 - Consumer Price Index (CPI)
Thu - Jun 18 - 10:00 - Philadelphia Fed
Thu - Jun 18 - 10:00 - Leading Economic Indicators
Thu - Jun 18 - 10:30 - Natural Gas Inventories
Mon - Jun 22 - 10:00 - Existing Home Sales
Tue - Jun 23 - 08:30 - Durable Goods Orders
Tue - Jun 23 - 09:00 - FHFA Housing Price Index
Tue - Jun 23 - 10:00 - New Home Sales
Wed - Jun 24 - 08:00 - EU Summit
Wed - Jun 24 - 07:00 - MBA Mortgage Index
Wed - Jun 24 - 08:30 - GDP
Wed - Jun 24 - 10:30 - Crude Oil Inventories
Thu - Jun 25 - 08:00 - EU Summit
Thu - Jun 25 - 08:30 - Initial Jobless Claims
Thu - Jun 25 - 08:30 - Personal Income & Spending
Thu - Jun 25 - 08:30 - PCE Prices
Thu - Jun 25 - 10:30 - Natural Gas Inventories
Fri - Jun 26 - 10:00 - Michigan Sentiment
This commentary is designed to stimulate thinking. This analysis is not a recommendation to buy, sell, hold or sell short any security (stock ETF or otherwise). We all need to think for ourselves when it comes to trading our own accounts. First, it is the only way to really learn. Second, we are the only ones responsible for our decisions. Think of these charts as food for further analysis. Before making a trade, it is important to have a plan. Plan the trade and trade the plan. Among other things, this includes setting a trigger level, a target area and a stop-loss level. It is also important to plan for three possible price movements: advance, decline or sideways. Have a plan for all three scenarios BEFORE making the trade. Consider possible holding times. And finally, look at overall market conditions and sector/industry performance.


