Stocks were flat on Thursday as the market digested Wednesday's big gain. The major index ETFs closed slightly higher with IWM gaining .25% and MDY leading with a .60% advance. The sectors were mixed with modest gains in industrials, materials and healthcare. Energy weakened as the USO Oil Fund (USO) stalled at flag resistance. The Solar Energy ETF (TAN) surged over 3%. Note that SPWR is bouncing off the top of a gap zone and the 38-50% retracement zone. Elsewhere, it was not a good day for commodities. The Copper ETN (JJC) led the Base Metals ETF (DBB) lower with a 2.74% plunge. This weighed on the Copper Miners ETF (COPX), which fell 1.74%. The Sugar ETN (SGG) fell to a new low and the Coffee ETF (JO) was down over 3%.
**This chart analysis is for educational purposes only, and should not
be construed as a recommendation to buy, sell or sell-short said securities**
Short-term Overview (Thursday, 11-June-2015):
- Short-term breadth is bearish, but there was an up thrust on Wednesday.
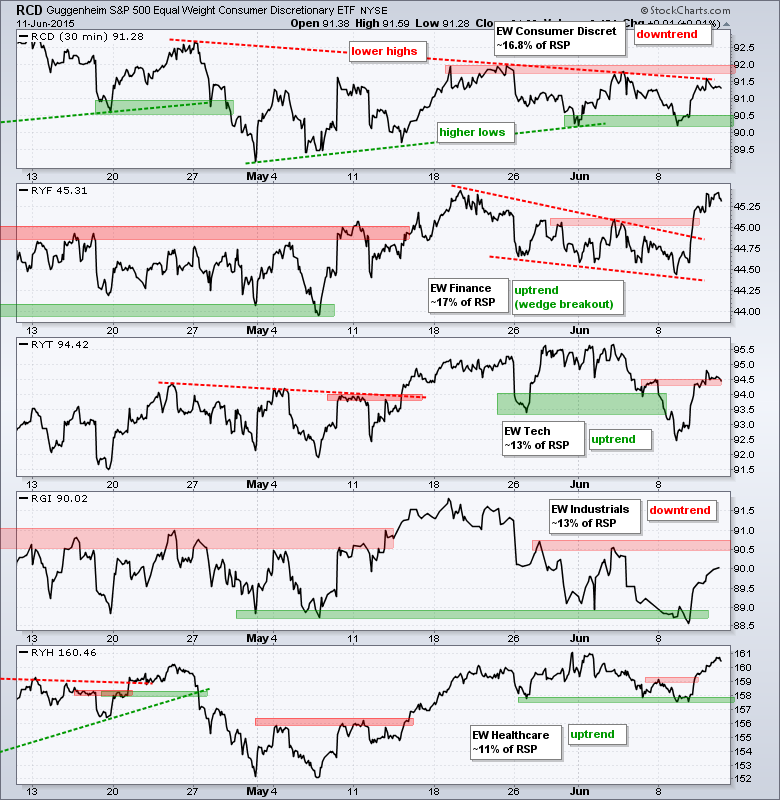
- Three of the five equal-weight sectors are in short-term uptrends.
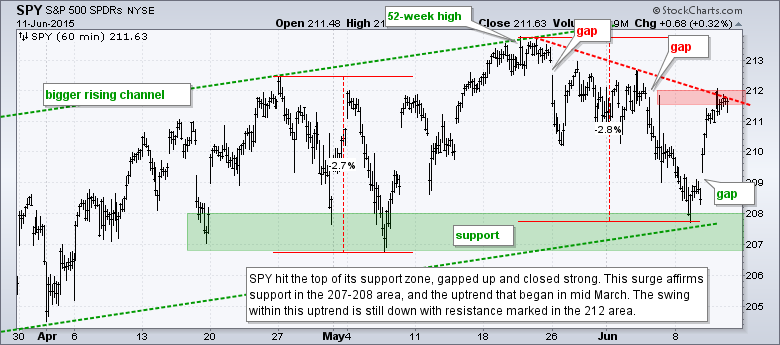
- SPY surged off medium-term support with a gap, but has yet to break short-term resistance.
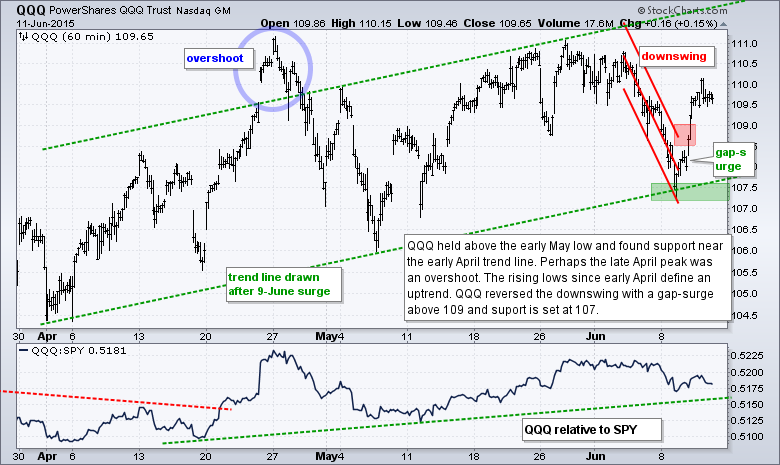
- QQQ formed a higher low and reversed its downswing with a gap-surge.
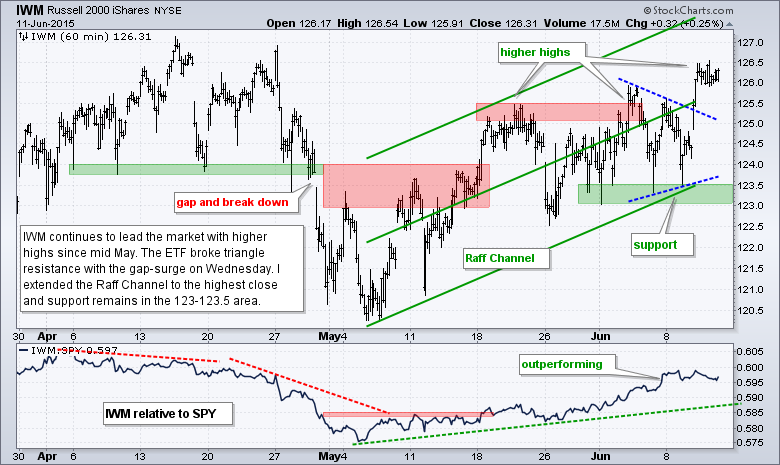
- IWM broke triangle resistance to extend its uptrend and shows relative strength.
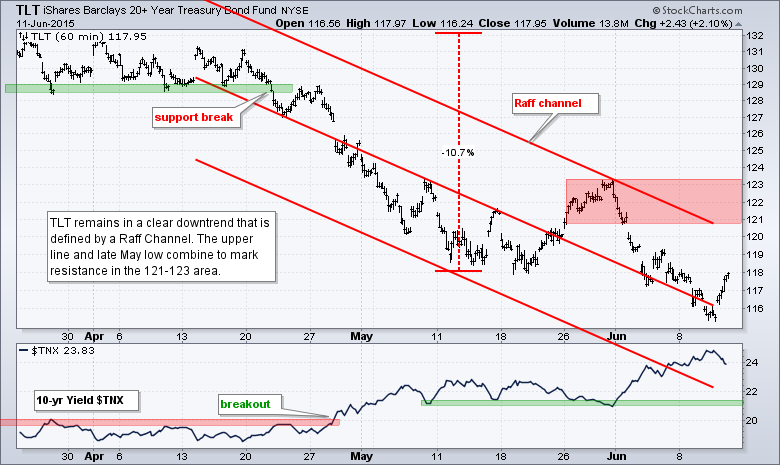
- TLT remains in a strong downtrend.
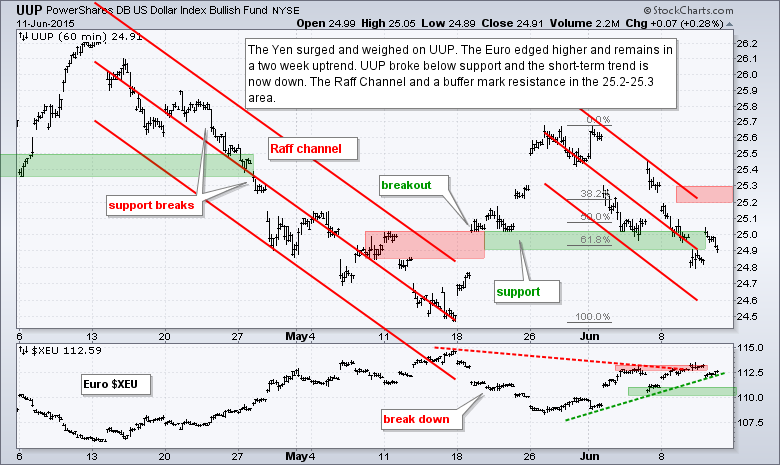
- UUP broke support to negate the breakout and start a short-term downtrend.
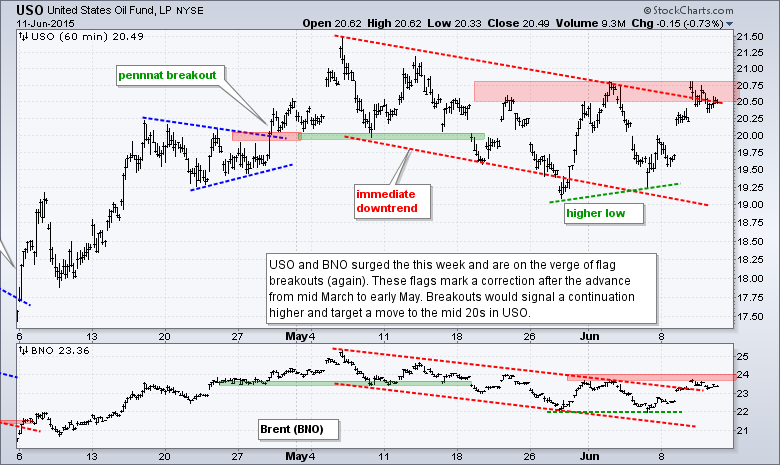
- USO is challenging resistance of a bull flag.
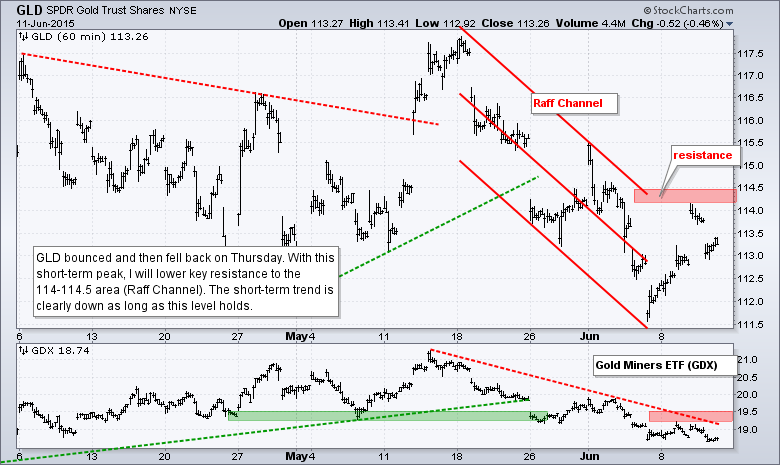
- GLD fell back on Thursday, remains in a short-term downtrend and I lowered resistance.
The Equal-Weight S&P 500 ETF (RSP) stalled at resistance and formed a doji. Indecision is nothing new because this market has been rather indecisive since March as RSP crossed the 82 level some 10 times the last three months. RSP has gone nowhere, but there is a clear upward drift to prices because of the higher highs.
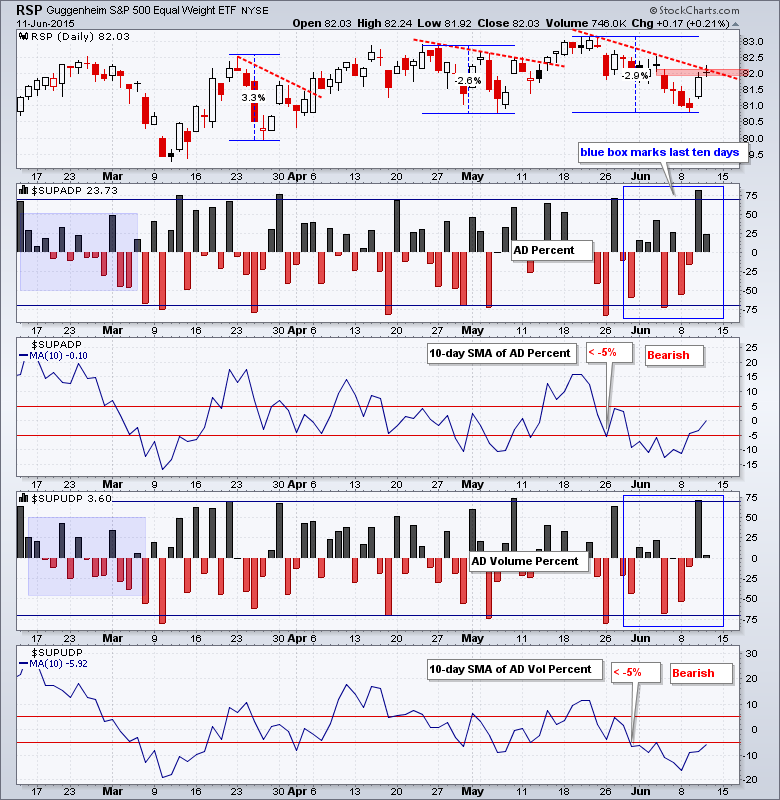
AD Percent and AD Volume Percent finished slightly positive as buying pressure subsided after Wednesday's up thrust. The 10-day SMAs are improving, but both remain in negative territory. Both need to clear +5% to turn short-term breadth bullish.
Three of the five equal-weight sector ETFs are in uptrends. The Equal-weight Finance ETF (RYF) is the strongest right now with a wedge breakout. The Equal-weight Healthcare ETF (RYH) is the second strongest and is near its high. The Equal-weight Technology ETF (RYT) gets third place and I am calling the trend up today. The Equal-Weight Consumer Discretionary ETF (RCD) is still within a narrowing range and we are waiting for the break. The Equal-weight Industrials ETF (RGI) got a nice bounce off support, but remains short of a breakout.
**************************************************************
**************************************************************
**************************************************************
**************************************************************
**************************************************************
**************************************************************
**************************************************************
***************************************************************
Key Reports and Events (all times Eastern):
Fri - Jun 12 - 08:30 - Producer Price Index (PPI)
Fri - Jun 12 - 10:00 - Michigan Sentiment
Mon - Jun 15 - 08:30 - Empire State Manufacturing
Mon - Jun 15 - 09:15 - Industrial Production
Mon - Jun 15 - 10:00 - NAHB Housing Market Index
Tue - Jun 16 - 08:30 - Housing Starts & Building Permits
Wed - Jun 17 - 07:00 - MBA Mortgage Index
Wed - Jun 17 - 10:30 - Crude Oil Inventories
Wed - Jun 17 - 14:00 - FOMC Rate Decision
Thu - Jun 18 - 08:30 - Initial Jobless Claims
Thu - Jun 18 - 08:30 - Consumer Price Index (CPI)
Thu - Jun 18 - 10:00 - Philadelphia Fed
Thu - Jun 18 - 10:00 - Leading Economic Indicators
Thu - Jun 18 - 10:30 - Natural Gas Inventories
Mon - Jun 22 - 10:00 - Existing Home Sales
Tue - Jun 23 - 08:30 - Durable Goods Orders
Tue - Jun 23 - 09:00 - FHFA Housing Price Index
Tue - Jun 23 - 10:00 - New Home Sales
Wed - Jun 24 - 07:00 - MBA Mortgage Index
Wed - Jun 24 - 08:30 - GDP
Wed - Jun 24 - 10:30 - Crude Oil Inventories
Thu - Jun 25 - 08:30 - Initial Jobless Claims
Thu - Jun 25 - 08:30 - Personal Income & Spending
Thu - Jun 25 - 08:30 - PCE Prices
Thu - Jun 25 - 10:30 - Natural Gas Inventories
Fri - Jun 26 - 10:00 - Michigan Sentiment
This commentary is designed to stimulate thinking. This analysis is not a recommendation to buy, sell, hold or sell short any security (stock ETF or otherwise). We all need to think for ourselves when it comes to trading our own accounts. First, it is the only way to really learn. Second, we are the only ones responsible for our decisions. Think of these charts as food for further analysis. Before making a trade, it is important to have a plan. Plan the trade and trade the plan. Among other things, this includes setting a trigger level, a target area and a stop-loss level. It is also important to plan for three possible price movements: advance, decline or sideways. Have a plan for all three scenarios BEFORE making the trade. Consider possible holding times. And finally, look at overall market conditions and sector/industry performance.


