Stocks opened weak and remained weak as the S&P 500 extended its two week slide. This slide started with the gap down on Tuesday, May 26th, the day after Memorial Day. Tech stocks led the way lower as QQQ lost around 1%. Small-caps held up relatively well as IWM fell around a half percent. The Semiconductor SPDR (XSD) led the tech sector lower with a 2% decline. Banks held up relatively well yet again as the Bank SPDR (KBE) and Regional Bank SPDR (KRE) edged higher. Biotechs also attracted some buying interest as the Biotech SPDR (XBI) managed a fractional gain.
**This chart analysis is for educational purposes only, and should not
be construed as a recommendation to buy, sell or sell-short said securities**
Short-term Overview (Tuesday, 9-June-2015):
- Short-term breadth is bearish.
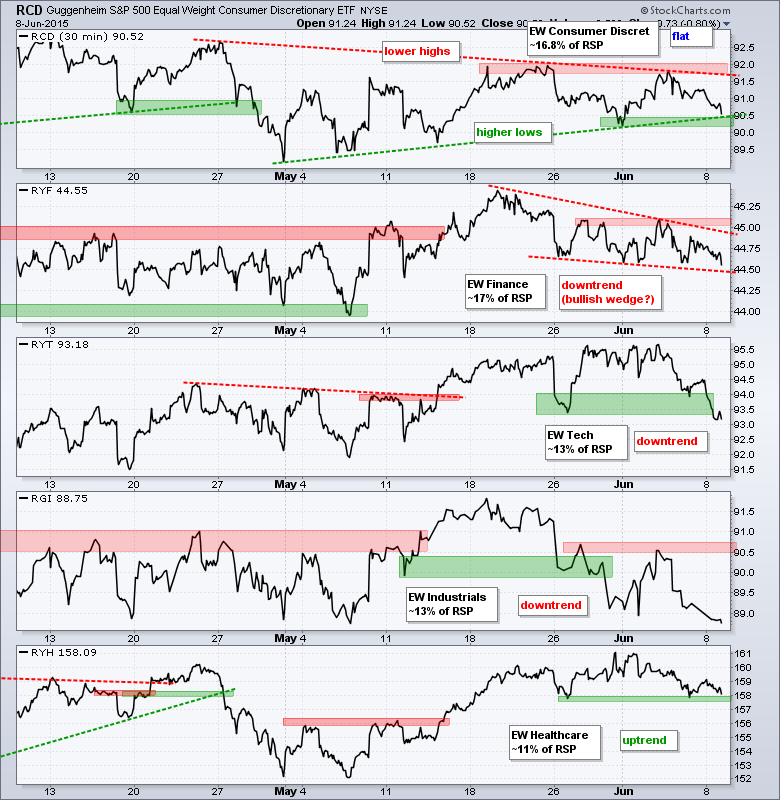
- Three of the five equal-weight sector ETFs are in downtrends.
- SPY is in a two week downtrend and approaching support from the May lows.
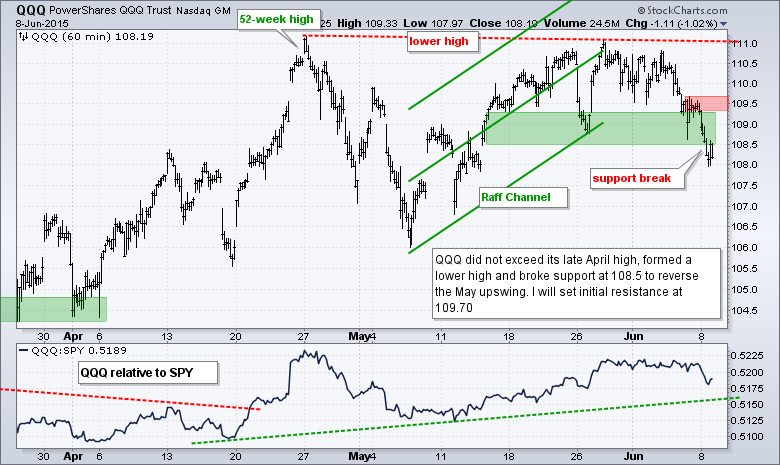
- QQQ broke support to start a short-term downtrend.
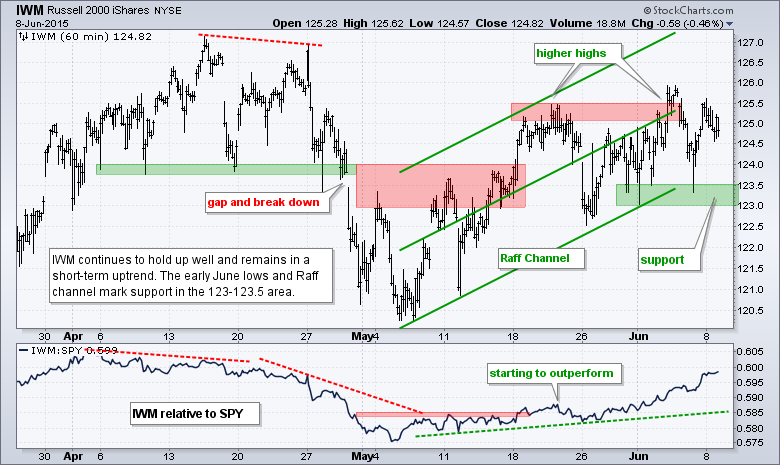
- IWM remains in a short-term uptrend and shows relative strength.
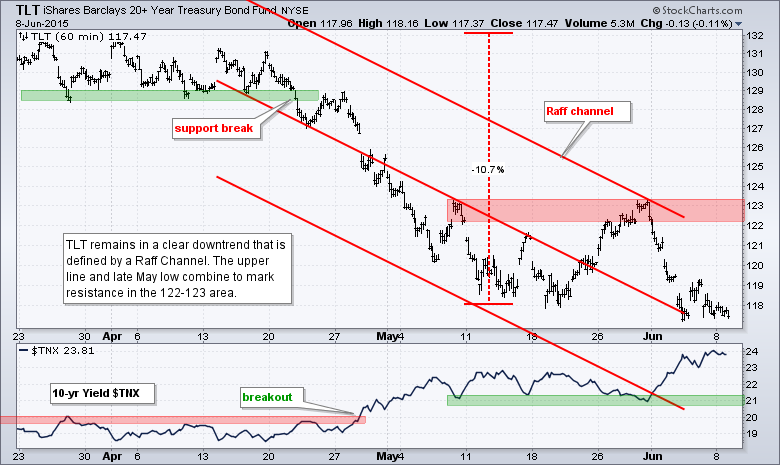
- TLT remains in a strong downtrend.
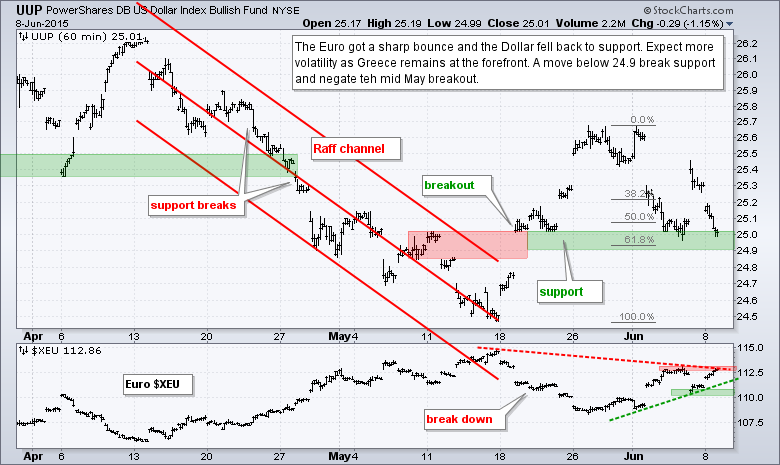
- UUP is testing the breakout zone once again.
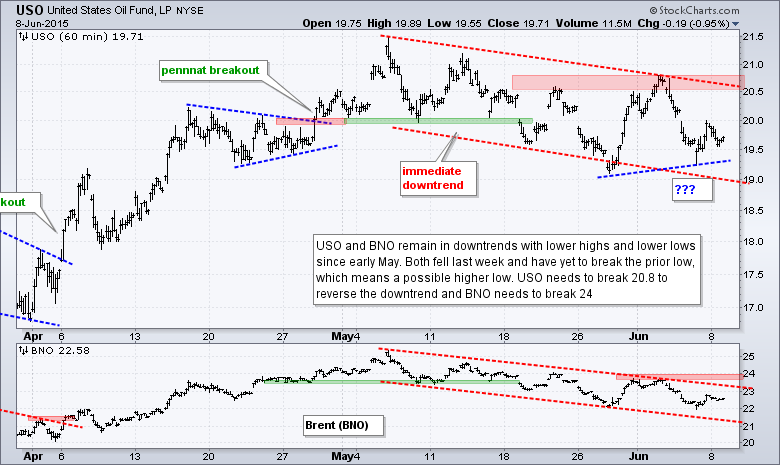
- USO remains in a short-term downtrend.
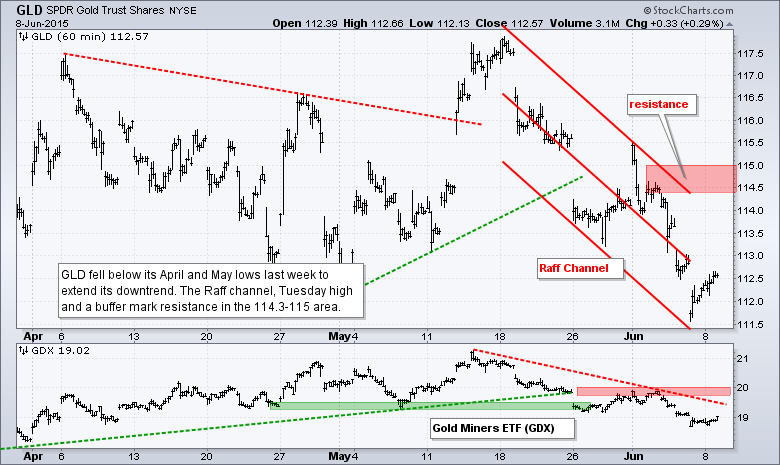
- GLD fell below the April-May lows and remains in a downtrend.
The Equal-Weight S&P 500 ETF (RSP) extended its decline and is now down around 2.5% in the last three weeks. I lowered first resistance to 82.1, which is marked by the mid May trend line and Thursday's high.
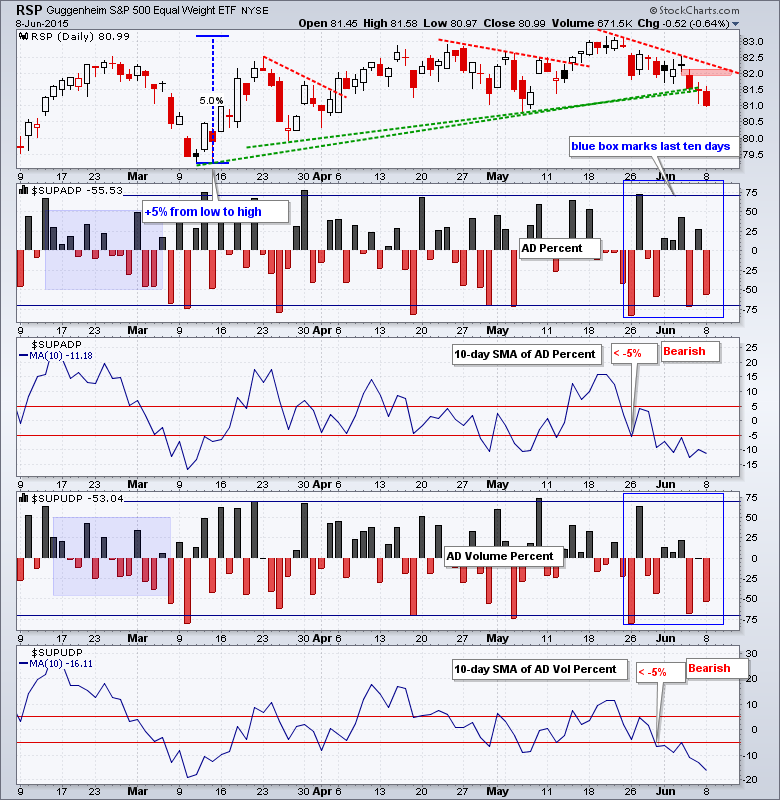
AD Percent and AD Volume Percent finished below -50% with fairly strong selling pressure. AD Percent has been below -50% four times in the last ten days and AD Volume Percent has been below -50% three times. Overall, short-term breadth has been bearish since late May when both moved below -5%.
Three of the five equal-weight sector ETFs are in downtrends. The Equal-Weight Consumer Discretionary ETF (RCD) is flat and within a trading range. The Equal-weight Healthcare ETF (RYH) has yet to break support. On the downside, the Equal-weight Finance ETF (RYF) remains in a falling wedge (downtrend). The Equal-weight Industrials ETF (RGI) broke below the May low (downtrend) and the Equal-weight Technology ETF (RYT) broke support on Monday (downtrend).
**************************************************************

**************************************************************
**************************************************************
**************************************************************
**************************************************************
**************************************************************
**************************************************************
***************************************************************
Key Reports and Events (all times Eastern):
Tue - Jun 09 - 10:00 - Wholesale Inventories
Tue - Jun 09 - 10:00 - JOLTS - Job Openings
Wed - Jun 10 - 07:00 - MBA Mortgage Index
Wed - Jun 10 - 10:30 - Crude Oil Inventories
Wed - Jun 10 - 14:00 - Treasury Budget
Thu - Jun 11 - 08:30 - Initial Jobless Claims
Thu - Jun 11 - 08:30 - Retail Sales
Thu - Jun 11 - 10:00 - Business Inventories
Thu - Jun 11 - 10:30 - Natural Gas Inventories
Fri - Jun 12 - 08:30 - Producer Price Index (PPI)
Fri - Jun 12 - 10:00 - Michigan Sentiment
Mon - Jun 15 - 08:30 - Empire State Manufacturing
Mon - Jun 15 - 09:15 - Industrial Production
Mon - Jun 15 - 10:00 - NAHB Housing Market Index
Tue - Jun 16 - 08:30 - Housing Starts & Building Permits
Wed - Jun 17 - 07:00 - MBA Mortgage Index
Wed - Jun 17 - 10:30 - Crude Oil Inventories
Wed - Jun 17 - 14:00 - FOMC Rate Decision
Thu - Jun 18 - 08:30 - Initial Jobless Claims
Thu - Jun 18 - 08:30 - Consumer Price Index (CPI)
Thu - Jun 18 - 10:00 - Philadelphia Fed
Thu - Jun 18 - 10:00 - Leading Economic Indicators
Thu - Jun 18 - 10:30 - Natural Gas Inventories
Mon - Jun 22 - 10:00 - Existing Home Sales
Tue - Jun 23 - 08:30 - Durable Goods Orders
Tue - Jun 23 - 09:00 - FHFA Housing Price Index
Tue - Jun 23 - 10:00 - New Home Sales
Wed - Jun 24 - 07:00 - MBA Mortgage Index
Wed - Jun 24 - 08:30 - GDP
Wed - Jun 24 - 10:30 - Crude Oil Inventories
Thu - Jun 25 - 08:30 - Initial Jobless Claims
Thu - Jun 25 - 08:30 - Personal Income & Spending
Thu - Jun 25 - 08:30 - PCE Prices
Thu - Jun 25 - 10:30 - Natural Gas Inventories
Fri - Jun 26 - 10:00 - Michigan Sentiment
This commentary is designed to stimulate thinking. This analysis is not a recommendation to buy, sell, hold or sell short any security (stock ETF or otherwise). We all need to think for ourselves when it comes to trading our own accounts. First, it is the only way to really learn. Second, we are the only ones responsible for our decisions. Think of these charts as food for further analysis. Before making a trade, it is important to have a plan. Plan the trade and trade the plan. Among other things, this includes setting a trigger level, a target area and a stop-loss level. It is also important to plan for three possible price movements: advance, decline or sideways. Have a plan for all three scenarios BEFORE making the trade. Consider possible holding times. And finally, look at overall market conditions and sector/industry performance.


