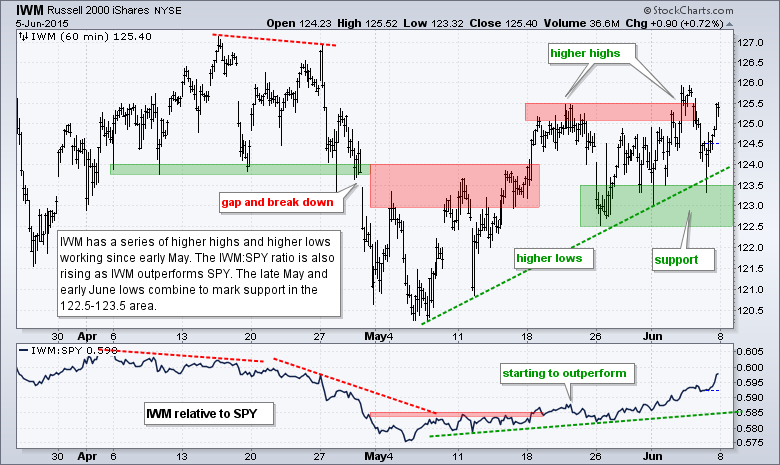
Stocks were mixed most of the week and the major index ETFs finished mixed. The S&P 500 SPDR (SPY) and Nasdaq 100 ETF (QQQ) edged lower, while the Russell 2000 iShares (IWM), S&P MidCap SPDR (MDY) and S&P SmallCap iShares (IJR) closed modestly higher (greater than 1%). Small-caps started showing relative strength in early May and relative strength continued in early June. The sectors were mixed as well with finance and consumer discretionary showing some strength. Utilities and consumer staples were slammed as money moved out of higher yielding stocks. The Broker-Dealer iShares (IAI) and the Regional Bank SPDR (KRE) were the big stories as both hit fresh 52-week highs and continue to lead the market. Overall, the market remains mixed with bearish breadth, a short-term uptrend in IWM, a downswing in SPY, flat trading in QQQ and a very mixed sector performance. This is a recipe for directionless trading.
**This chart analysis is for educational purposes only, and should not
be construed as a recommendation to buy, sell or sell-short said securities**
Short-term Overview (Monday, 8-June-2015):
- Short-term breadth is bearish.
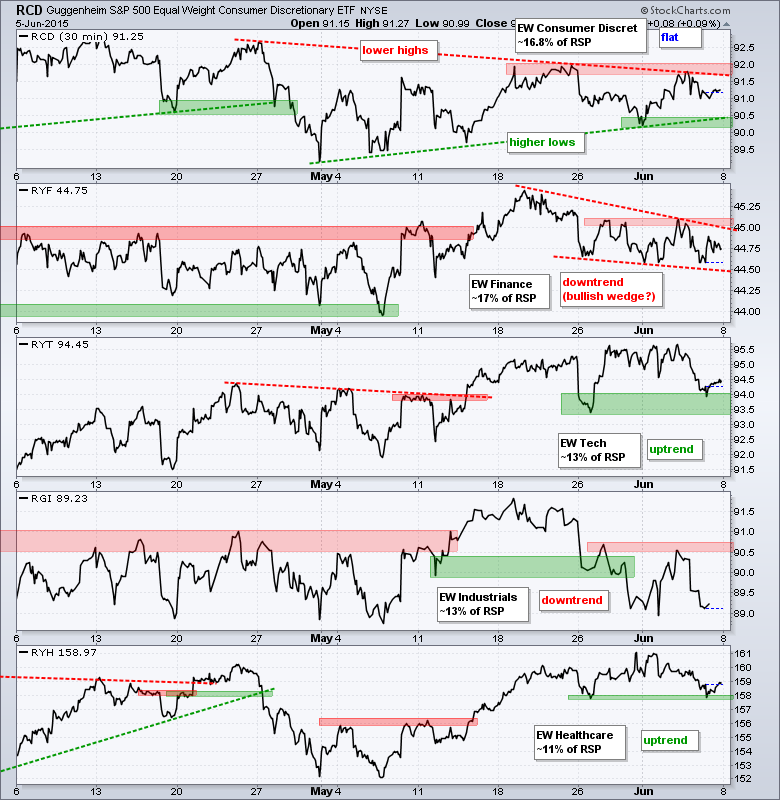
- The equal-weight sectors are mixed: 2 up, 2 down and 1 flat.
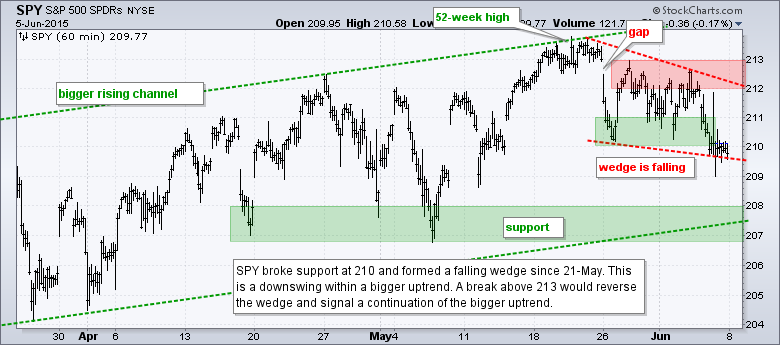
- SPY formed a falling wedge the last two weeks.
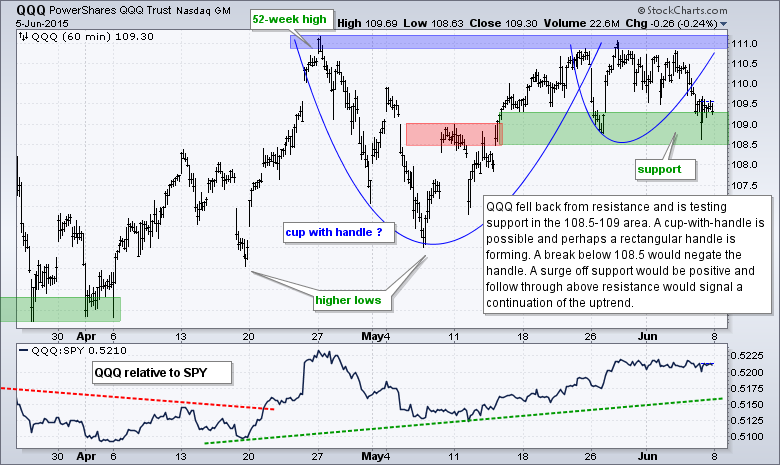
- QQQ is consolidating above support with a possible cup-with-handle.
- IWM remains in a short-term uptrend and shows relative strength.
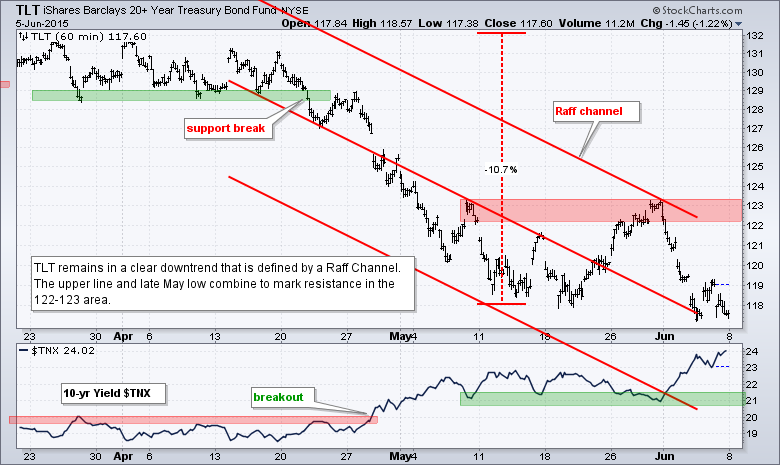
- TLT remains in a strong downtrend.
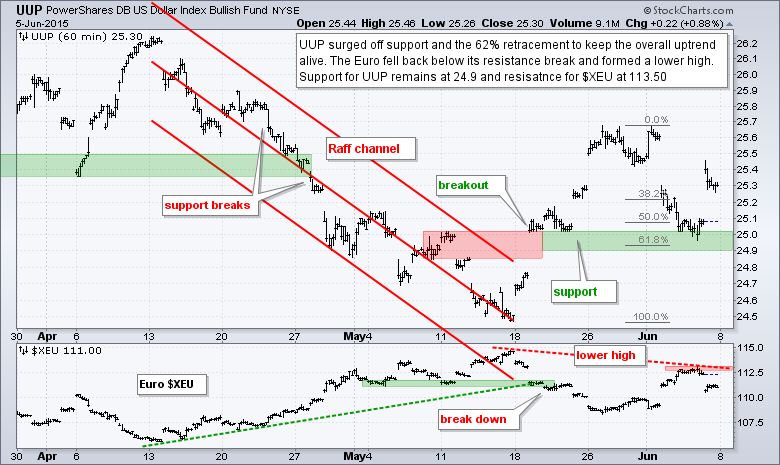
- UUP bounced off broken resistance and a key retracement to keep the uptrend alive.
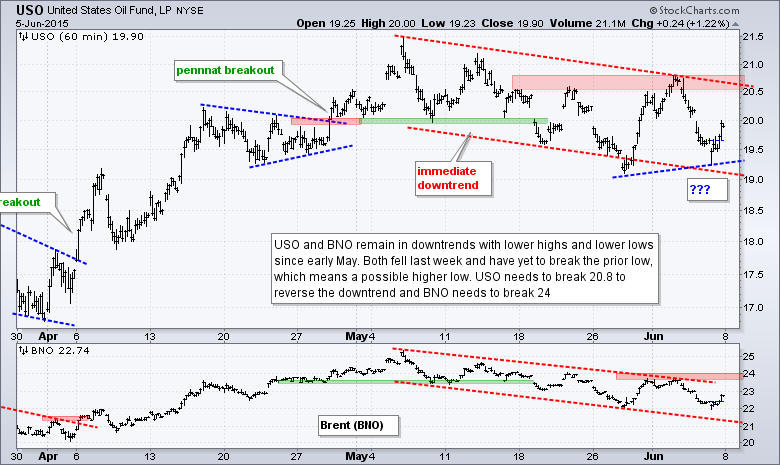
- USO remains in a short-term downtrend.
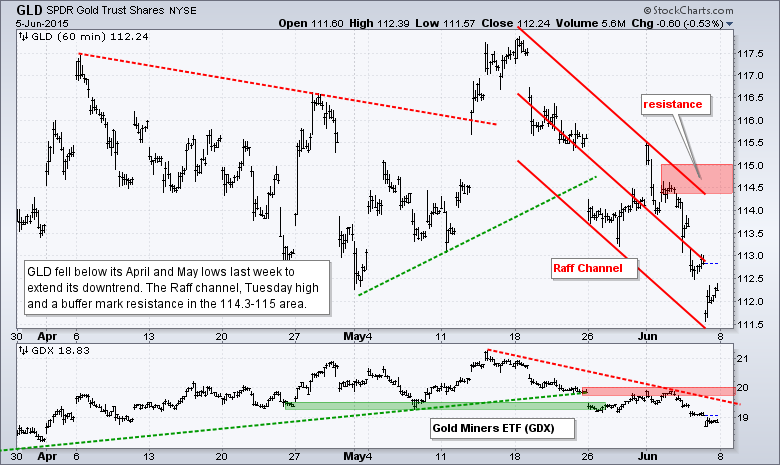
- GLD fell below the April-May lows and remains in a downtrend.
The Equal-Weight S&P 500 ETF (RSP) fell over the last two weeks and finished with a doji near support at 81.51 on Friday. The doji signals indecision that can sometimes foreshadow a reversal, but the downswing is in play as long as resistance in the 82-82.5 area holds.
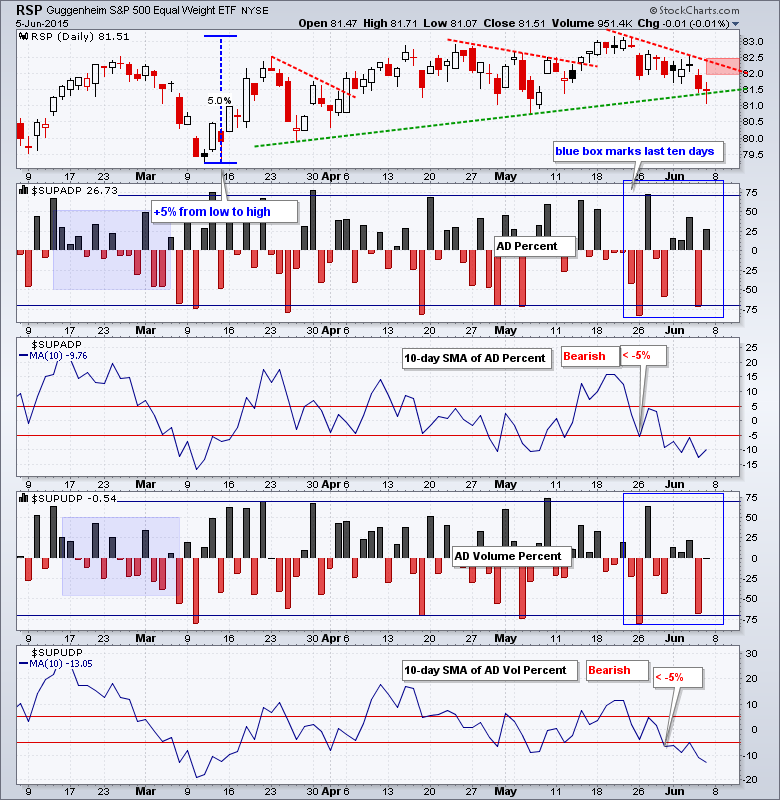
AD Percent was actually positive four of the last five days, but remains bearish overall because the negative bars (red) are clearly longer than the positive bars (black). AD Volume Percent finished slightly negative on Friday and the 10-day SMA remains in bear mode.
The equal-weight sector ETFs remain mixed overall. The Equal-Weight Consumer Discretionary ETF (RCD) is flat and could break either way. The Equal-weight Finance ETF (RYF) remains within a falling wedge. Both need to break last week's highs to reverse their short-term downtrends. The Equal-weight Industrials ETF (RGI) fell back from resistance and also needs to break last week's high to reverse the short-term downtrend. The Equal-weight Technology ETF (RYT) and Equal-weight Healthcare ETF (RYH) both fell last week and bounced off short-term support on Friday. Breakdowns in these two leaders would be quite negative for the market overall.
**************************************************************
**************************************************************
**************************************************************
**************************************************************
**************************************************************
**************************************************************
**************************************************************
***************************************************************
Keep in mind that Friday is a loaded day. We have non-farm payrolls, the deadline for Greece and an OPEC meeting. Probably best just to turn off the market and watch the semi-final between Djokovic and Murray.
Key Reports and Events (all times Eastern):
Tue - Jun 09 - 10:00 - Wholesale Inventories
Tue - Jun 09 - 10:00 - JOLTS - Job Openings
Wed - Jun 10 - 07:00 - MBA Mortgage Index
Wed - Jun 10 - 10:30 - Crude Oil Inventories
Wed - Jun 10 - 14:00 - Treasury Budget
Thu - Jun 11 - 08:30 - Initial Jobless Claims
Thu - Jun 11 - 08:30 - Retail Sales
Thu - Jun 11 - 10:00 - Business Inventories
Thu - Jun 11 - 10:30 - Natural Gas Inventories
Fri - Jun 12 - 08:30 - Producer Price Index (PPI)
Fri - Jun 12 - 10:00 - Michigan Sentiment
Mon - Jun 15 - 08:30 - Empire State Manufacturing
Mon - Jun 15 - 09:15 - Industrial Production
Mon - Jun 15 - 10:00 - NAHB Housing Market Index
Tue - Jun 16 - 08:30 - Housing Starts & Building Permits
Wed - Jun 17 - 07:00 - MBA Mortgage Index
Wed - Jun 17 - 10:30 - Crude Oil Inventories
Wed - Jun 17 - 14:00 - FOMC Rate Decision
Thu - Jun 18 - 08:30 - Initial Jobless Claims
Thu - Jun 18 - 08:30 - Consumer Price Index (CPI)
Thu - Jun 18 - 10:00 - Philadelphia Fed
Thu - Jun 18 - 10:00 - Leading Economic Indicators
Thu - Jun 18 - 10:30 - Natural Gas Inventories
Mon - Jun 22 - 10:00 - Existing Home Sales
Tue - Jun 23 - 08:30 - Durable Goods Orders
Tue - Jun 23 - 09:00 - FHFA Housing Price Index
Tue - Jun 23 - 10:00 - New Home Sales
Wed - Jun 24 - 07:00 - MBA Mortgage Index
Wed - Jun 24 - 08:30 - GDP
Wed - Jun 24 - 10:30 - Crude Oil Inventories
Thu - Jun 25 - 08:30 - Initial Jobless Claims
Thu - Jun 25 - 08:30 - Personal Income & Spending
Thu - Jun 25 - 08:30 - PCE Prices
Thu - Jun 25 - 10:30 - Natural Gas Inventories
Fri - Jun 26 - 10:00 - Michigan Sentiment
This commentary is designed to stimulate thinking. This analysis is not a recommendation to buy, sell, hold or sell short any security (stock ETF or otherwise). We all need to think for ourselves when it comes to trading our own accounts. First, it is the only way to really learn. Second, we are the only ones responsible for our decisions. Think of these charts as food for further analysis. Before making a trade, it is important to have a plan. Plan the trade and trade the plan. Among other things, this includes setting a trigger level, a target area and a stop-loss level. It is also important to plan for three possible price movements: advance, decline or sideways. Have a plan for all three scenarios BEFORE making the trade. Consider possible holding times. And finally, look at overall market conditions and sector/industry performance.


