Stocks chopped around on Monday with the S&P 500 trading in an 18 point range the entire day. The major index ETFs finished with small gains led by the Russell MicroCap iShares (+.40%). The sectors were mixed with energy, materials and consumer staples showing some weakness. Healthcare, industrials and technology showed some strength. The Home Construction iShares (ITB) acted well with a .64% gain and airlines surged as the Airline ETF (JETS) gained 2.38%. I will cover ITB and some homebuilder charts in today's webinar (1PM ET). I will also take an in-depth look at MACD and divergences. Click here to register.
**This chart analysis is for educational purposes only, and should not
be construed as a recommendation to buy, sell or sell-short said securities**
Short-term Overview (Tuesday, 2-June-2015):
- Short-term breadth is bearish as both indicators broke key levels.
- Three of the five equal-weight sectors are in downtrends.
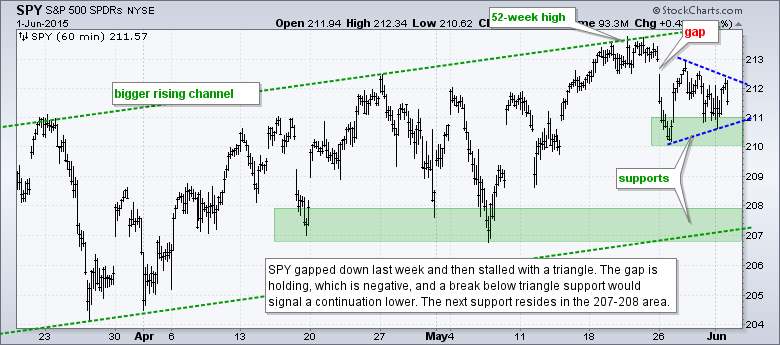
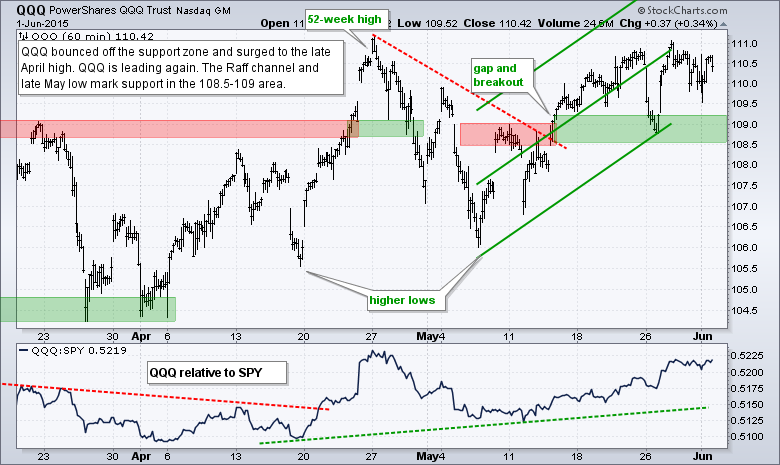
- SPY and QQQ are consolidating above support.
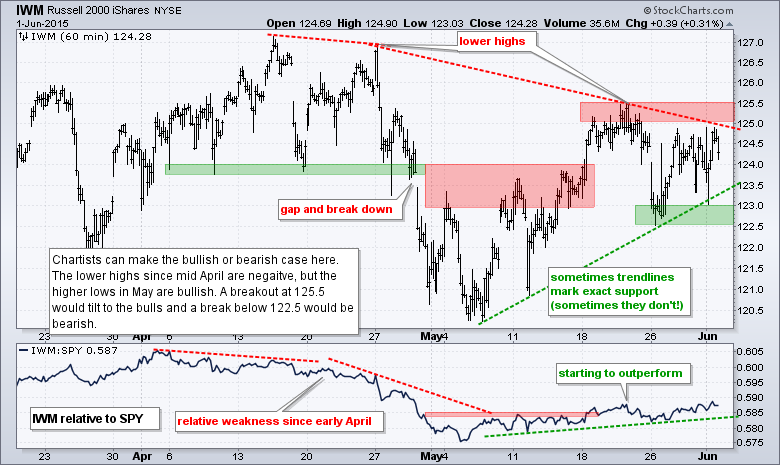
- IWM remains within a contracting range.
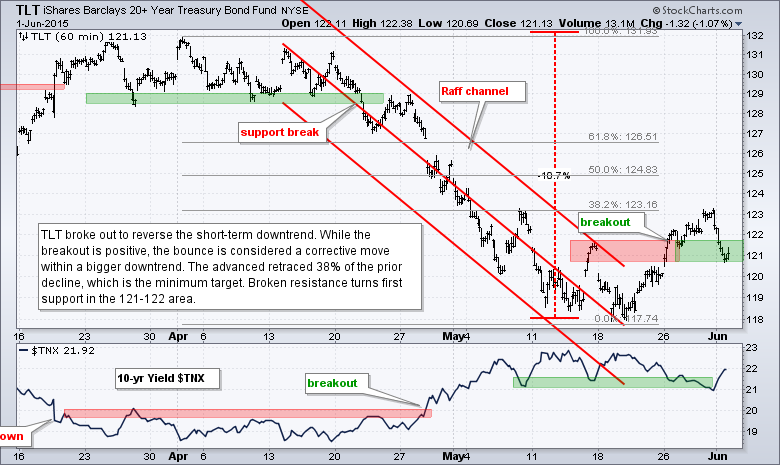
- TLT fell back and is testing support.
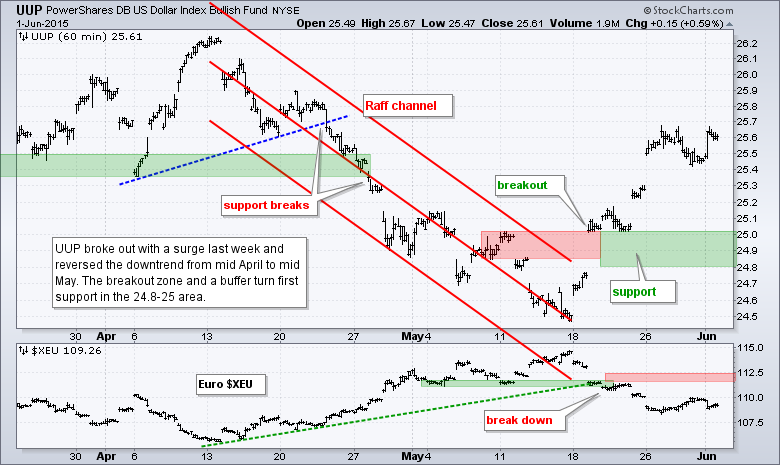
- UUP is in a short-term uptrend.
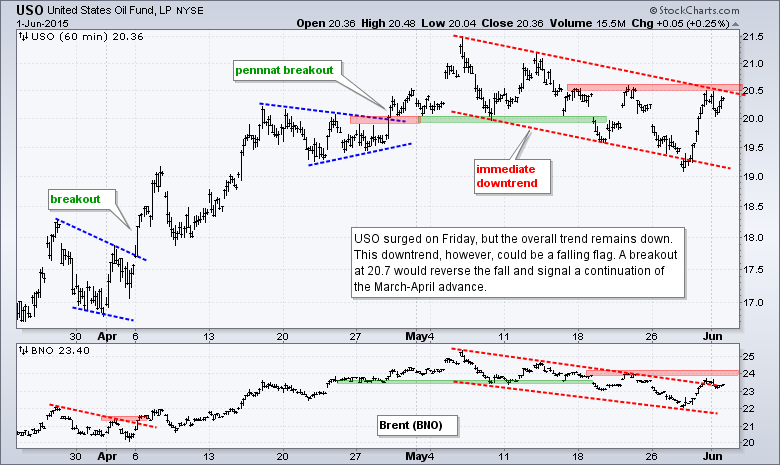
- USO surged to channel resistance, but remains short of a trend-changing breakout.
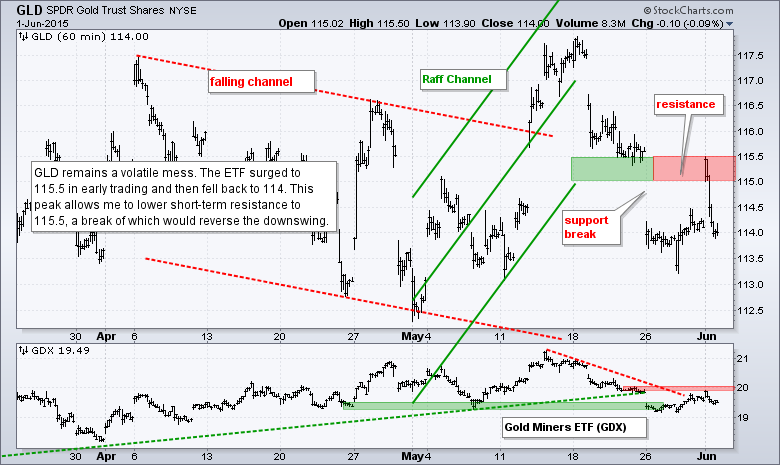
- GLD remains very volatile and the current swing is down.
The Equal-Weight S&P 500 ETF (RSP) firmed on Monday and the ETF is testing support in the 81.5-82 area. This is the third pullback of the grinding uptrend since mid March.
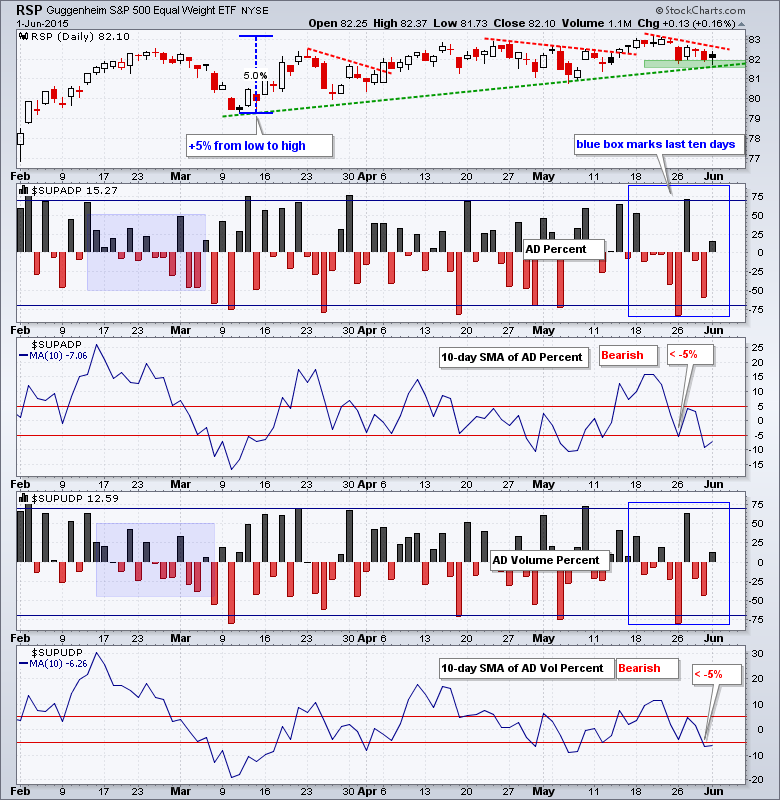
AD Percent and AD Volume Percent finished positive on Monday, but buying pressure was weak as both ended the day below +20%. Overall, breadth is bearish as both 10-day SMAs moved below -5% last week.
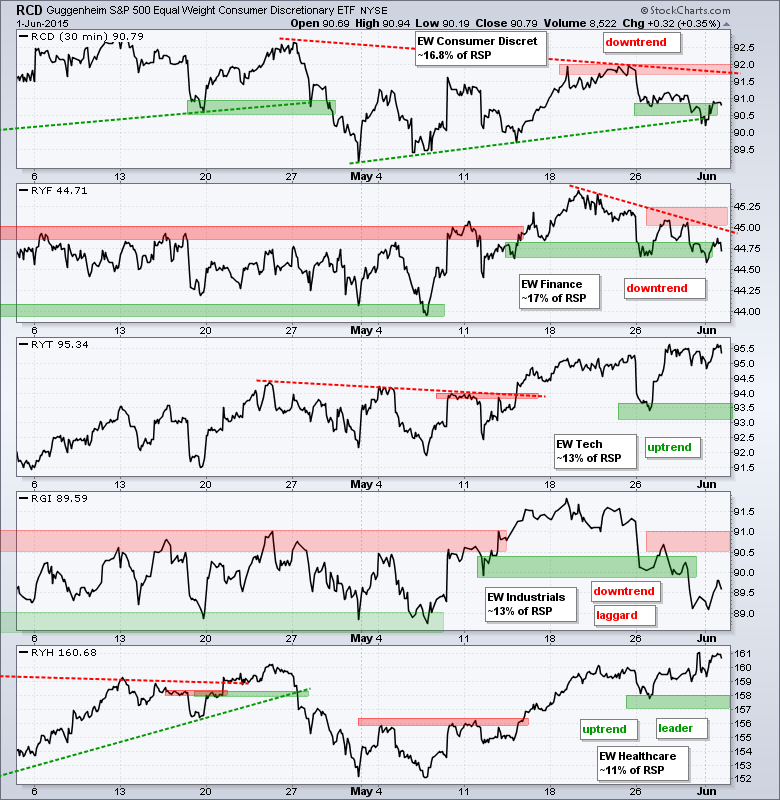
Three of the five equal-weight sectors are in downtrends. Consumer discretionary and industrials were in downtrends to start the week. Finance broke support on Tuesday to tilt the sector balance to the bears. The technology and healthcare sectors remain in strong uptrends and near their highs.
**************************************************************
**************************************************************
**************************************************************
**************************************************************
**************************************************************
**************************************************************
**************************************************************
***************************************************************
While I am not sure if the news will affect existing trends, we can expect some added volatility in stocks, bonds, the Euro and gold. The economic docket is full with over a dozen releases. These include ISM Manufacturing on Monday, Auto-Truck Sales on Tuesday, ISM Services on Wednesday, Initial Claims on Thursday and non-farm payrolls on Friday. Friday is also June 5th, which is the deadline for Greece to make a big payment to the IMF. We can expect this "deadline" to go down to the wire and the outcome could affect the Euro, Dollar, and gold. I may just have to whip up some Tzatziki on Friday.
Key Reports and Events (all times Eastern):
Tue - Jun 02 - 10:00 - Factory Orders
Tue - Jun 02 - 17:00 - Auto/Truck Sales
Wed - Jun 03 - 07:00 - MBA Mortgage Index
Wed - Jun 03 - 08:15 - ADP Employment Report
Wed - Jun 03 - 08:30 - Trade Balance
Wed - Jun 03 - 10:00 - ISM Services Index
Wed - Jun 03 - 10:30 - Crude Oil Inventories
Wed - Jun 03 - 14:00 - Fed Beige Book
Thu - Jun 04 - 07:30 - Challenger Job Report
Thu - Jun 04 - 08:30 - Initial Jobless Claims
Thu - Jun 04 - 10:30 - Natural Gas Inventories
Fri - Jun 05 - 08:30 - Employment Report
Fri - Jun 05 - 14:00 - Consumer Credit
Tue - Jun 09 - 10:00 - Wholesale Inventories
Tue - Jun 09 - 10:00 - JOLTS - Job Openings
Wed - Jun 10 - 07:00 - MBA Mortgage Index
Wed - Jun 10 - 10:30 - Crude Oil Inventories
Wed - Jun 10 - 14:00 - Treasury Budget
Thu - Jun 11 - 08:30 - Initial Jobless Claims
Thu - Jun 11 - 08:30 - Retail Sales
Thu - Jun 11 - 10:00 - Business Inventories
Thu - Jun 11 - 10:30 - Natural Gas Inventories
Fri - Jun 12 - 08:30 - Producer Price Index (PPI)
Fri - Jun 12 - 10:00 - Michigan Sentiment
Mon - Jun 15 - 08:30 - Empire State Manufacturing
Mon - Jun 15 - 09:15 - Industrial Production
Mon - Jun 15 - 10:00 - NAHB Housing Market Index
Tue - Jun 16 - 08:30 - Housing Starts & Building Permits
Wed - Jun 17 - 07:00 - MBA Mortgage Index
Wed - Jun 17 - 10:30 - Crude Oil Inventories
Wed - Jun 17 - 14:00 - FOMC Rate Decision
Thu - Jun 18 - 08:30 - Initial Jobless Claims
Thu - Jun 18 - 08:30 - Consumer Price Index (CPI)
Thu - Jun 18 - 10:00 - Philadelphia Fed
Thu - Jun 18 - 10:00 - Leading Economic Indicators
Thu - Jun 18 - 10:30 - Natural Gas Inventories
Mon - Jun 22 - 10:00 - Existing Home Sales
Tue - Jun 23 - 08:30 - Durable Goods Orders
Tue - Jun 23 - 09:00 - FHFA Housing Price Index
Tue - Jun 23 - 10:00 - New Home Sales
Wed - Jun 24 - 07:00 - MBA Mortgage Index
Wed - Jun 24 - 08:30 - GDP
Wed - Jun 24 - 10:30 - Crude Oil Inventories
Thu - Jun 25 - 08:30 - Initial Jobless Claims
Thu - Jun 25 - 08:30 - Personal Income & Spending
Thu - Jun 25 - 08:30 - PCE Prices
Thu - Jun 25 - 10:30 - Natural Gas Inventories
Fri - Jun 26 - 10:00 - Michigan Sentiment
This commentary is designed to stimulate thinking. This analysis is not a recommendation to buy, sell, hold or sell short any security (stock ETF or otherwise). We all need to think for ourselves when it comes to trading our own accounts. First, it is the only way to really learn. Second, we are the only ones responsible for our decisions. Think of these charts as food for further analysis. Before making a trade, it is important to have a plan. Plan the trade and trade the plan. Among other things, this includes setting a trigger level, a target area and a stop-loss level. It is also important to plan for three possible price movements: advance, decline or sideways. Have a plan for all three scenarios BEFORE making the trade. Consider possible holding times. And finally, look at overall market conditions and sector/industry performance.


