Stocks chopped around again on Tuesday with the S&P 500 falling to 2100 on the open, bouncing back to 2117 in the early afternoon and settling around 2110 by the close. Overall, the major index ETFs ended the day mixed. DIA and QQQ edged lower, while IWM and MDY edged higher. Note that small-caps have been quietly outperforming since May 1st. Note that IWM is up 2.76% since May 1st, QQQ is up 2.27% and SPY is up 1.33%. Utilities were hit hard and led the way lower. Healthcare took a break and also fell back, while energy bounced along with oil. Elsewhere, the Retail SPDR (XRT) showed some spunk and gained .72%. A breakout at 100 would be bullish for this key industry group ETF. Banks were also strong as the Bank SPDR (KBE) gained over 1% on the day.
**This chart analysis is for educational purposes only, and should not
be construed as a recommendation to buy, sell or sell-short said securities**
Short-term Overview (Wednesday, 3-June-2015):
- Short-term breadth is bearish.
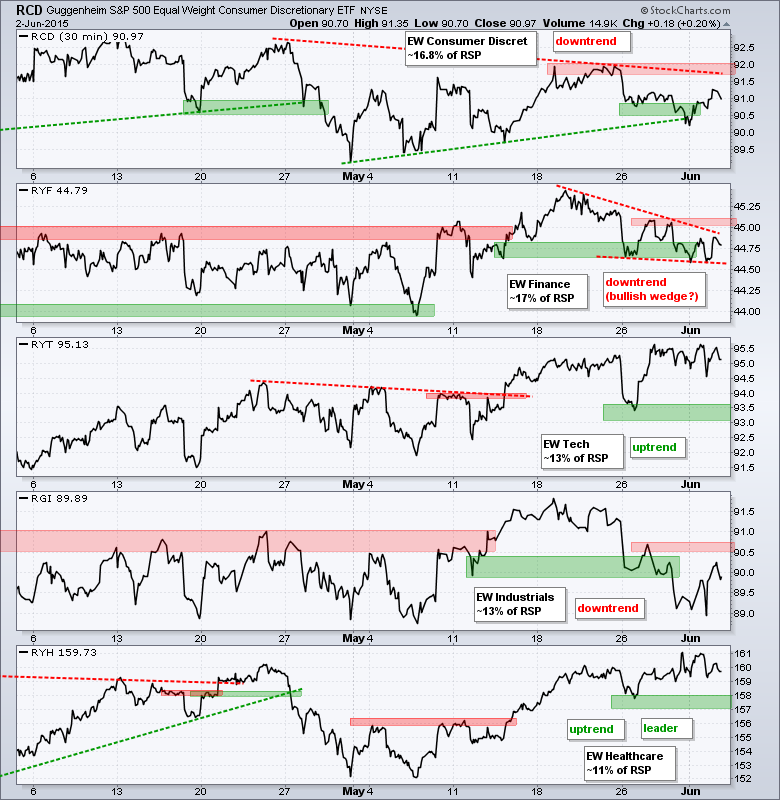
- Three of the five equal-weight sectors are in downtrends.
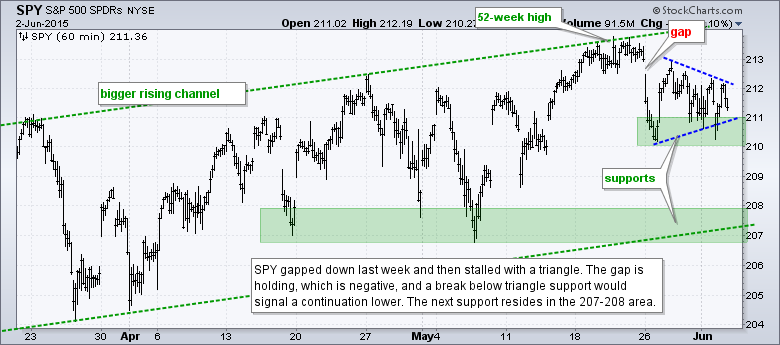
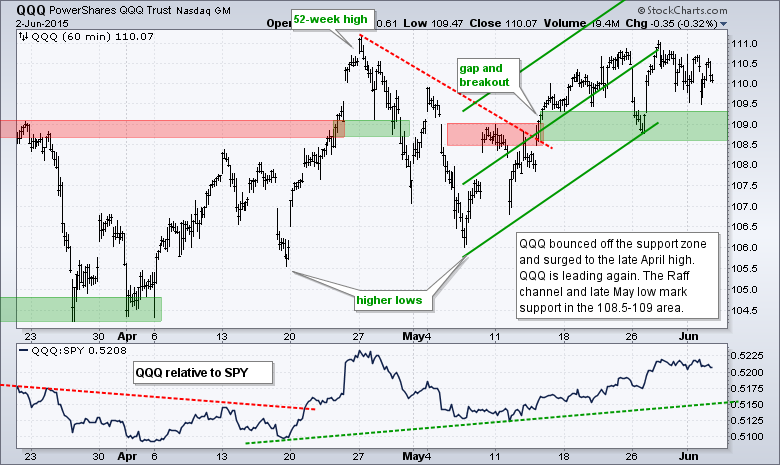
- SPY and QQQ are consolidating above support.
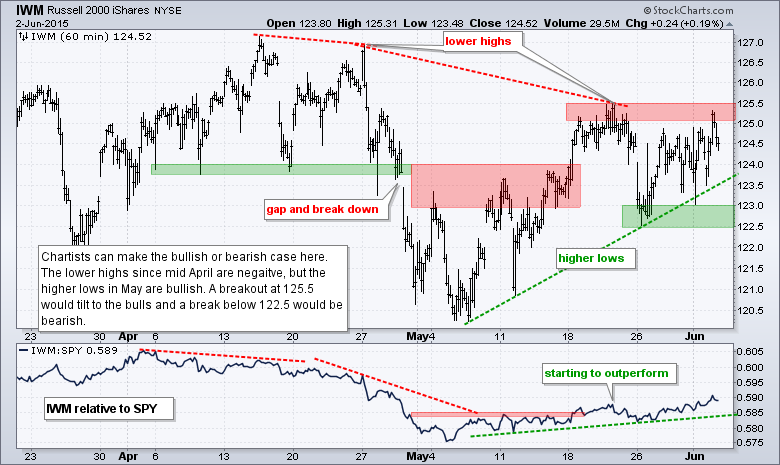
- IWM remains within a contracting range.
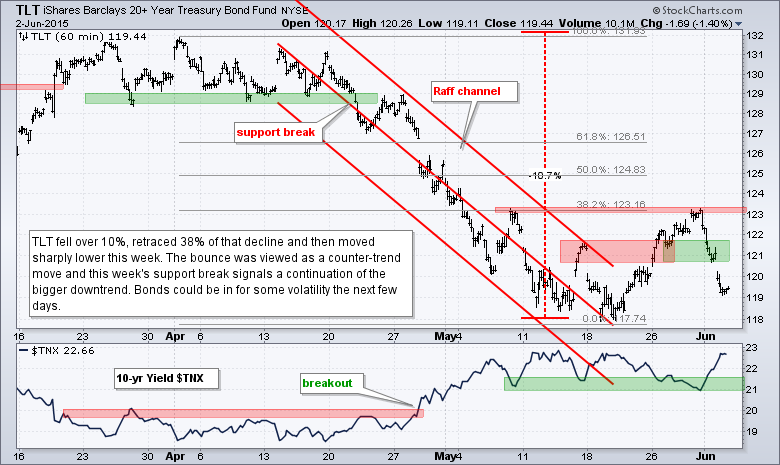
- TLT broke support to reverse the short-term upswing and continue the bigger downtrend.
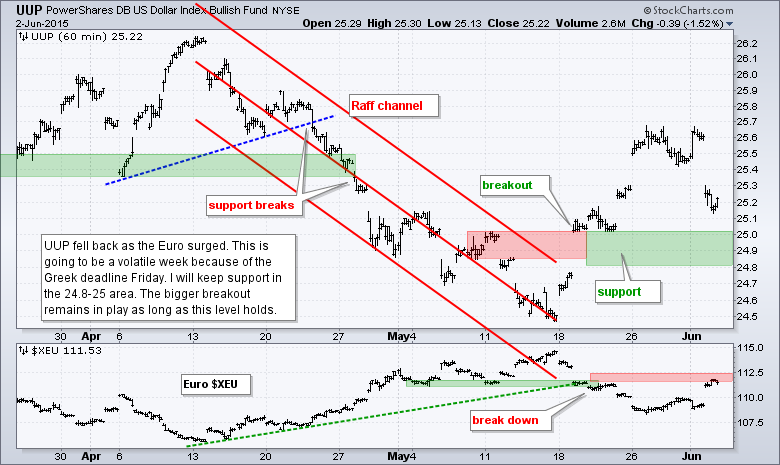
- UUP fell back hard, but remains in a bigger uptrend and above support.
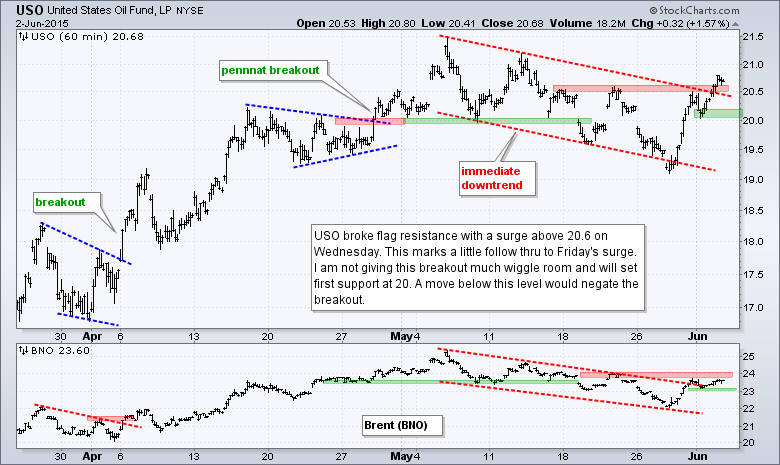
- USO broke channel resistance to reverse the short-term downtrend, but I am keeping support tight.
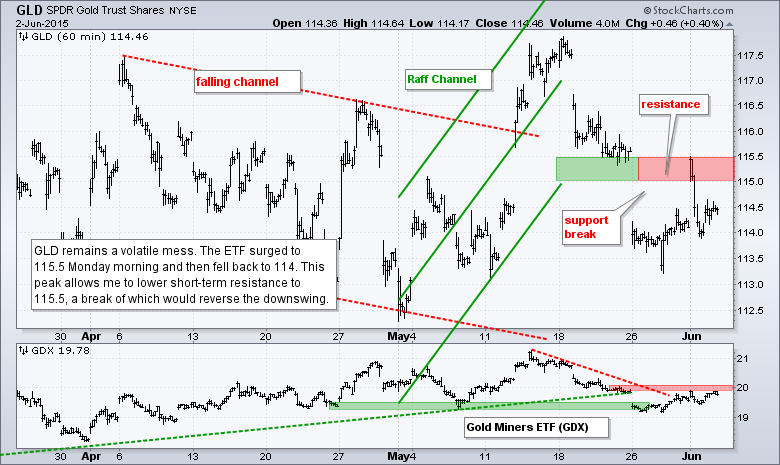
- GLD remains very volatile and the current swing is down.
The Equal-Weight S&P 500 ETF (RSP) firmed again on Tuesday with a spinning top candlestick. Note that the ETF is right at support and turning indecisive in a make-or-break area. Last week's gap held and I am marking downswing resistance at 82.5, a break of which could reverse the six day slide.
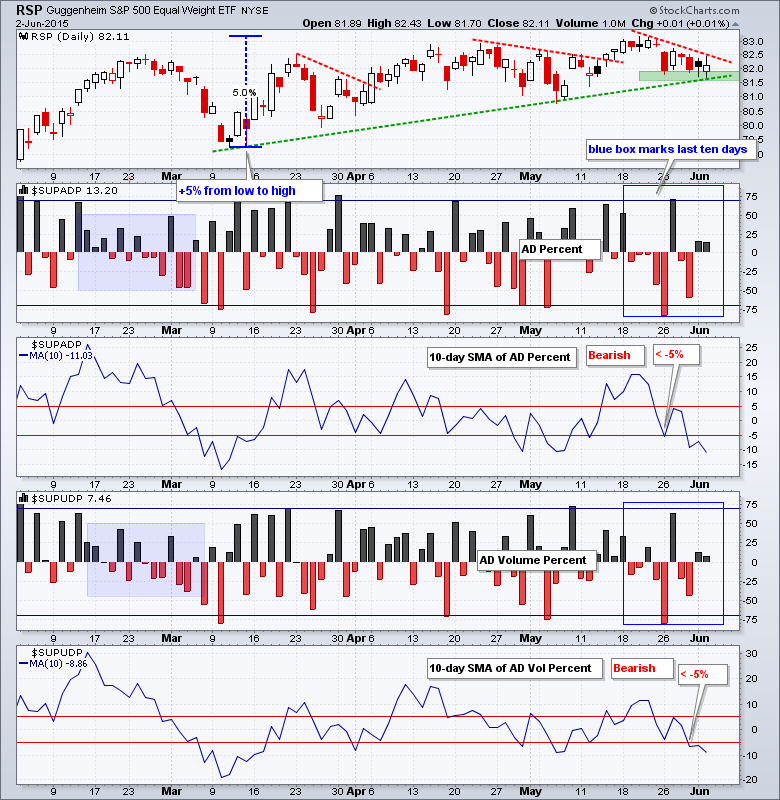
AD Percent and AD Volume Percent finished slightly positive again on Tuesday. The readings were more neutral than positive because neither exceeded +15%. Overall, the 10-day SMAs turned bearish last week and moved further below -5% on Tuesday. This is because a bigger positive breadth reading was dropped from the 10-day SMA and a smaller positive breadth reading was added.
Three of the five equal-weight sectors are in downtrends, but there is still a lot of flatness out there. I am watching the Equal-Weight Consumer Discretionary ETF (RCD) and Equal-weight Finance ETF (RYF) closely. Both are in downtrends and breakouts would help the broader market move higher. RCD formed a lower high in mid May, but has higher lows working since early May. Look for a break above 92.10 to reverse last week's break down. RYF is trending down with a falling wedge that could turn out to be corrective. Look for a break above 45.1 to reverse this slide.
**************************************************************
**************************************************************
**************************************************************
**************************************************************
**************************************************************
**************************************************************
**************************************************************
***************************************************************
Keep in mind that Friday is a loaded day. We have non-farm payrolls, the deadline for Greece and an OPEC meeting.
Key Reports and Events (all times Eastern):
Wed - Jun 03 - 07:00 - MBA Mortgage Index
Wed - Jun 03 - 08:15 - ADP Employment Report
Wed - Jun 03 - 08:30 - Trade Balance
Wed - Jun 03 - 10:00 - ISM Services Index
Wed - Jun 03 - 10:30 - Crude Oil Inventories
Wed - Jun 03 - 14:00 - Fed Beige Book
Thu - Jun 04 - 07:30 - Challenger Job Report
Thu - Jun 04 - 08:30 - Initial Jobless Claims
Thu - Jun 04 - 10:30 - Natural Gas Inventories
Fri - Jun 05 - 08:30 - Employment Report
Fri - Jun 05 - 14:00 - Consumer Credit
Tue - Jun 09 - 10:00 - Wholesale Inventories
Tue - Jun 09 - 10:00 - JOLTS - Job Openings
Wed - Jun 10 - 07:00 - MBA Mortgage Index
Wed - Jun 10 - 10:30 - Crude Oil Inventories
Wed - Jun 10 - 14:00 - Treasury Budget
Thu - Jun 11 - 08:30 - Initial Jobless Claims
Thu - Jun 11 - 08:30 - Retail Sales
Thu - Jun 11 - 10:00 - Business Inventories
Thu - Jun 11 - 10:30 - Natural Gas Inventories
Fri - Jun 12 - 08:30 - Producer Price Index (PPI)
Fri - Jun 12 - 10:00 - Michigan Sentiment
Mon - Jun 15 - 08:30 - Empire State Manufacturing
Mon - Jun 15 - 09:15 - Industrial Production
Mon - Jun 15 - 10:00 - NAHB Housing Market Index
Tue - Jun 16 - 08:30 - Housing Starts & Building Permits
Wed - Jun 17 - 07:00 - MBA Mortgage Index
Wed - Jun 17 - 10:30 - Crude Oil Inventories
Wed - Jun 17 - 14:00 - FOMC Rate Decision
Thu - Jun 18 - 08:30 - Initial Jobless Claims
Thu - Jun 18 - 08:30 - Consumer Price Index (CPI)
Thu - Jun 18 - 10:00 - Philadelphia Fed
Thu - Jun 18 - 10:00 - Leading Economic Indicators
Thu - Jun 18 - 10:30 - Natural Gas Inventories
Mon - Jun 22 - 10:00 - Existing Home Sales
Tue - Jun 23 - 08:30 - Durable Goods Orders
Tue - Jun 23 - 09:00 - FHFA Housing Price Index
Tue - Jun 23 - 10:00 - New Home Sales
Wed - Jun 24 - 07:00 - MBA Mortgage Index
Wed - Jun 24 - 08:30 - GDP
Wed - Jun 24 - 10:30 - Crude Oil Inventories
Thu - Jun 25 - 08:30 - Initial Jobless Claims
Thu - Jun 25 - 08:30 - Personal Income & Spending
Thu - Jun 25 - 08:30 - PCE Prices
Thu - Jun 25 - 10:30 - Natural Gas Inventories
Fri - Jun 26 - 10:00 - Michigan Sentiment
This commentary is designed to stimulate thinking. This analysis is not a recommendation to buy, sell, hold or sell short any security (stock ETF or otherwise). We all need to think for ourselves when it comes to trading our own accounts. First, it is the only way to really learn. Second, we are the only ones responsible for our decisions. Think of these charts as food for further analysis. Before making a trade, it is important to have a plan. Plan the trade and trade the plan. Among other things, this includes setting a trigger level, a target area and a stop-loss level. It is also important to plan for three possible price movements: advance, decline or sideways. Have a plan for all three scenarios BEFORE making the trade. Consider possible holding times. And finally, look at overall market conditions and sector/industry performance.


